This study presents a novel technique to determine the tensile strength of single flax yarn of canvas, using zero-span strength analysis. The technique was applied to both artificially aged fabric and naturally aged canvas from historical artworks, yielding reproducible and representative results. Subsequently, the degree of polymerization of the cellulose was determined by capillary viscometry. A linear correlation could be shown between the degree of cellulose polymerization obtained from capillary viscometry and the tensile strength obtained from zero-span tensile strength measurements. These results demonstrate the value of this technique, which is more straightforward than capillary viscometry and requires significantly smaller samples. This approach offers great potential for determining the mechanical properties of an original canvas and for supporting the decision-making process about conservation treatments.
16. A Novel Technique to Determine the Strength of Canvas and Its Correlation with the Degree of Cellulose Polymerization
- Theresa A. Bräunig, Conservator, Old National Gallery, Berlin
- Anna von Reden, Professor, Stuttgart State Academy of Art and Design
- Dirk A. Lichtblau, Director, Lichtblau e.K., Dresden
- Christoph Herm, Professor, Dresden University of Fine Arts
Introduction
In order to make educated decisions about the ability to transport paintings and the potential need for an appropriate conservation treatment, it is crucial to know the mechanical strength of a canvas. However, methods to measure this and related parameters are scarce. Even today, the assessment of original canvas is often based only on its optical appearance, such as browning and yellowing, and pH value. However, these parameters are not directly related to age and mechanical properties.
Flax is frequently used for the canvases of historical paintings. It is a natural fiber and consists mainly of cellulose. The most dominant degradation process of such canvases is the depolymerization of cellulose by hydrolysis, which in turn influences their mechanical strength (Timar-Balazsy, Ágnes, and Dinah Eastop. 1998. Chemical Principles of Textile Conservation. Oxford: Butterworth-Heinemann.). In 1939, Staudinger and Reinecke investigated a potential correlation between aging, cellulose depolymerization, and the mechanical strength of historical canvas (Staudinger, H., and F. Reinecke. 1939. “Über den Polymerisationsgrad von Zellulosen in alten Geweben.” Melliand Textilberichte 20: 109–10.). So far, however, this correlation has not been experimentally proven. For paper, in contrast, a link between the mechanical properties and the degree of cellulose depolymerization has been found (Zou, X., N. Gurnagul, T. Uesaka, and J. Bouchard. 1994. “Accelerated Aging of Papers of Pure Cellulose: Mechanism of Cellulose Degradation and Paper Embrittlement.” Polymer Degradation and Stability 43, no. 3: 393–402.).
In textile engineering. the tensile strength of fabrics is determined by using standard protocols that require a minimum length of 200 mm; for the testing of yarns, a minimum length of 250 mm is needed. Those requirements limit their application to conservation research. If large amounts of sample material are available, such as for artificially aged canvas, it is possible to determine the strength of the material using methods such as the standard tensile test method on fabric or yarn, which gives a maximum tensile strength value (Reumann, Ralf-Dieter. 2000. “Mechanisches Formänderungsverhalten textiler Materialien.” In Prüfverfahren in der Textil- und Bekleidungstechnik, edited by Ralf-Dieter Reumann, 57–125. New York: Springer-Verlag.), but to date no direct correlation between the age-related chemical alterations of the cellulose molecular constitution and the physical consequences for the fabric has been established (Young, Christina. 2005. “Accelerated Aging of Fabric Supports: Is It Possible?” In Scientific Analysis of Ancient and Historic Textiles: Informing Preservation, Display and Interpretation: Postprints, edited by Rob Janaway and Paul Wyeth, 111–17. London: Archetype.). The reason for this is the lack of methods to investigate original canvases. Thus, the determination of the degree of cellulose depolymerization by viscometry was until now the only method available to investigate the constitution of original canvas (Stoll, Manfred, and Dietrich Fengel. 1981. “Untersuchungen über die Alterung von Cellulose anhand von altägyptischen Leinenproben.” Das Papier 35: 178–85.). However, the measured degree of polymerization is difficult to assess with respect to the aging process and the mechanical properties. Therefore, a technique for measuring the mechanical properties on smaller components of a canvas such as yarns or fibers is needed.
Yarns are structures composed of fibers, and a yarn’s geometry is determined by the fibers’ diameter, gradient angle, density, and homogeneity of the material (Peirce, Frederick Thomas. 1937. “The Geometry of Cloth Structure.” Journal of the Textile Institute 27: T45–T96.). It is likely that the strong influence the fabric geometry has on the measurements may prevent a direct correlation of the age with tensile strength as determined by the above-mentioned standard methodology. It seems conceivable that the thinnest site of the sample ruptures first, or that thinner single fibers are displaced from longer single fibers during the measurement. Thus, we conclude that to determine a correlation between the degree of polymerization of cellulose and the mechanical properties, a novel technique for measuring the tensile strength is needed—one that largely excludes the influence of the textile geometry on the measurement.
To date, three standard methods are used to determine the strength of cellulosic fiber material: (1) the band-pulling method on plain textile structures (DIN (Deutsches Institut für Normung). 1999. Textilien—Zugeigenschaften von textilen Flächengebilden—Teil 1: Bestimmung der Höchstzugkraft und Höchstzugkraft-Dehnung mit dem Streifen-Zugversuch [Tensile properties of fabrics—Part 1: Determination of Maximum Force and Elongation at Maximum Force Using the Strip Method]. EN ISO 13934-1. Berlin: DIN.); (2) the determination of the maximum tensile strength on single fibers (DIN (Deutsches Institut für Normung). 2009. Textilien—Garne von Aufmachungseinheiten—Bestimmung der Höchstzugkraft und Höchstzugkraftdehnung von Garnabschnitten unter Verwendung eines Prüfgeräts mit konstanter Verformungsgeschwindigkeit (CRE) [Textiles—Yarns from Packages—Determination of Single-End Breaking Force and Elongation at Break Using Constant Rate of Extension (CRE) Tester]. EN ISO 2062:2009. Berlin: DIN.); and (3) the determination of the maximum tensile strength on staple fibers (DIN (Deutsches Institut für Normung). 1996. Textilien–Fasern—Bestimmung der Höchstzugkraft und Höchstzugkraftdehnung an Spinnfasern [Textile Fibres—Determination of Breaking Force and Elongation at Break of Individual Fibres]. EN ISO 5079. Berlin: DIN.). However, as already mentioned, none of these standard techniques fulfills the requirements applicable to original canvas samples. The comparison of the degree of cellulose polymerization with the maximum tensile strength of artificially aged linen (flax fabric), measured with the band-pulling method on plain-weave fabrics, did not yield a correlation (Von Reden, Anna. 2018. “Studien zum hygrischen Verhalten gealterter Leinwände (Studies on the Hygric Behavior of Aged Canvases.” PhD diss., Dresden University of Fine Arts. https://nbn-resolving.org/urn:nbn:de:bsz:14-qucosa2-340450.). In this study, we propose that the influence of the fabric geometry during these measurements prevents the resulting values from faithfully resembling the molecular condition of the cellulose, and that the same applies to the determination of the maximum tensile strength on single yarn.
In the research field of paper analysis, an alternative method for the analysis of single fiber strength is frequently applied to this problem: the determination of the zero-span tensile strength (TAPPI (Technical Association of the Pulp and Paper Industry). 2007. Zero-Span Breaking Strength of Pulp (Dry Zero-Span Tensile). T 231 cm-07. Atlanta: TAPPI.). The special feature of this method is the fact that the clamping distance is reduced to almost zero, and hence the strength of the fibers is measured at a defined position. In this way, measurement errors arising from the heterogeneity of the material along the overall length of the sample are minimized. In the international literature, the resulting value is called zero-span tensile strength (Henniges, Ute, and Antje Potthast. 2000. Halbstoff—Bestimmung der Nullreißfestigkeit, naß oder trocken. ISO 15361. Berlin: DIN., Henniges, Ute, and Antje Potthast. 2015. “Charakterisierung von Papier.” In Papier und Wasser: Ein Lehrbuch für Restauratoren, Konservierungswissenschaftler und Papiermacher, edited by Gehrhardt Banik and Irene Brückle, 275–318. Munich: Siegel.). Applying the zero-span tensile strength test method to yarn would represent an important technical advancement.
Previous studies have reported on this topic, but to date no standardized protocol or validation of the method exists (Hackney, Stephen, and Gerry Hedley. 1984. “Linen Canvas Artificially Aged.” In ICOM Committee for Conservation: 7th Triennial Meeting: Copenhagen, 10–14 September 1984, edited by Diana de Froment, 84.82.16–21. Paris: ICOM in association with the J. Paul Getty Trust.; Leene, Jentina E., L. Demeny, R. J. Elema, A. J. de Graaf, and J. J. Surtel. 1975. “Artificial Ageing of Yarns in Presence As Well As in Absence of Light and under Different Atmospheric Conditions.” In ICOM Committee for Conservation: 4th Triennial Meeting, Venice, 13–18 October 1975: Preprints, 75/10/2-1–11. Paris: ICOM.). Transferring this technique to the conservation of paintings, however, would be highly desirable. The goal of our work was to investigate the applicability of the zero-span tensile strength method to single yarns and to develop a standard protocol. The second aim was to use this technique to study samples derived from original canvas to assess its implementation in conservation research. The overarching question was whether a correlation exists between the intrinsic viscosity and the maximum tensile strength. This study was conducted at Dresden University of Fine Arts, Germany.
Methods
Development of a Standard Protocol to Determine the Zero-Span Tensile Strength of Yarns
The general workflow of this study is as follows: yarn samples were taken from both new and artificially aged fabrics as well as from original canvas paintings. The maximum tensile strength at zero length of single yarn samples was determined using the newly developed method described in more detail below. Then identical sample material was disassembled into single fibers and the intrinsic viscosity (limiting viscosity number) determined.
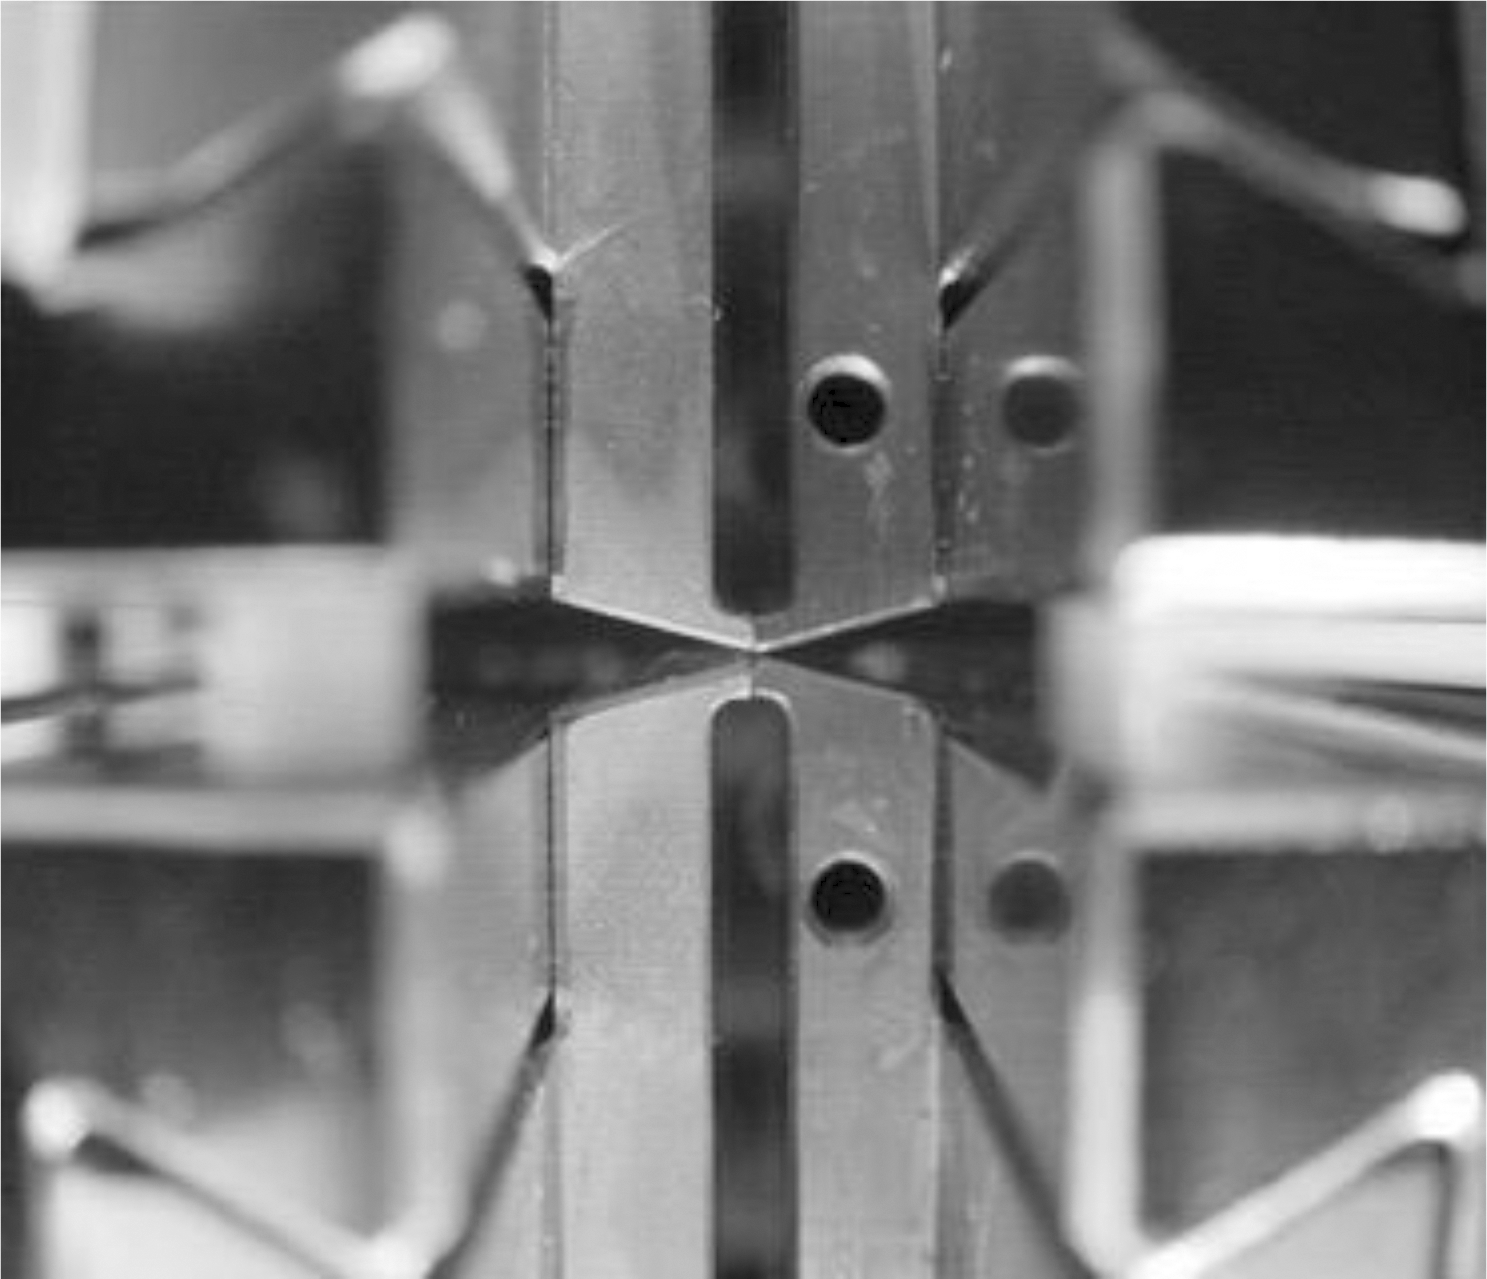
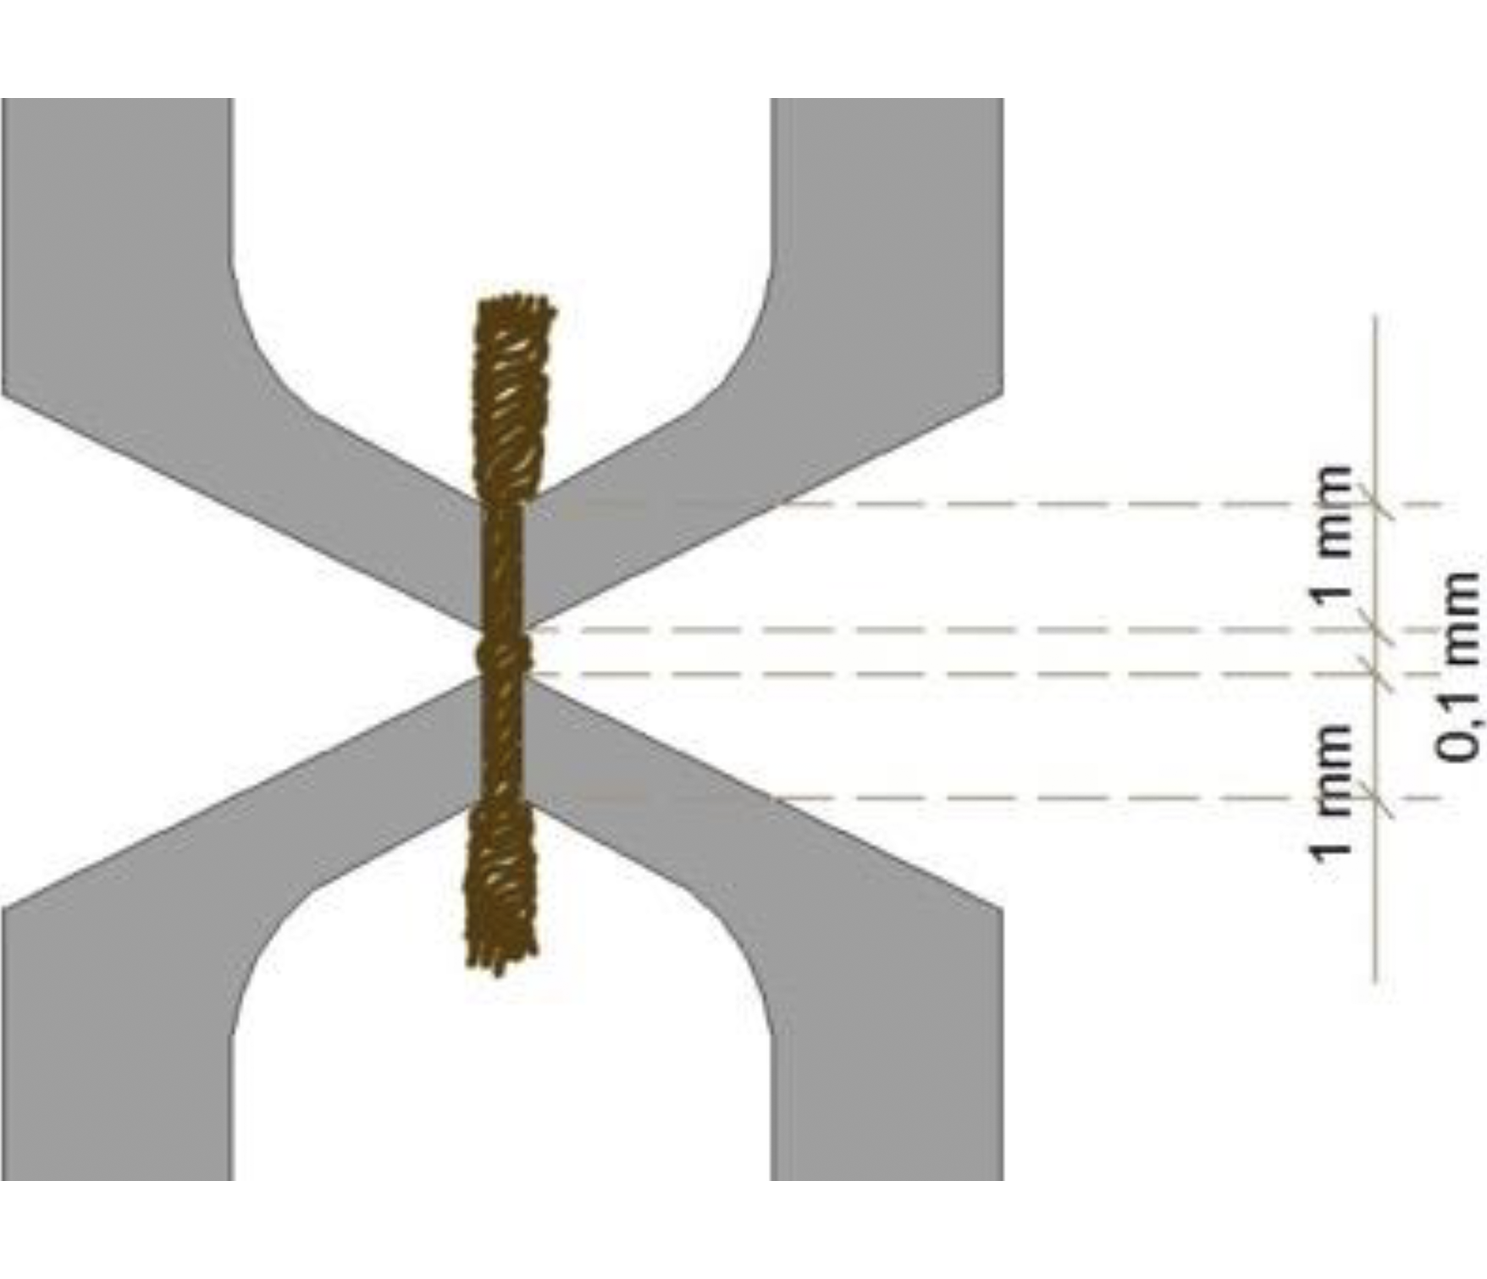
The existing protocol for the zero-span tensile strength determination of paper was modified for its application to yarn samples, and a standard protocol was developed. The general rules for measuring maximum tensile strength also apply to the zero-span tensile strength. The critical difference between the protocols is the clamping distance. In reality, the clamping distance for determining the zero-span tensile strength is set to 0.1 mm in order to avoid compression of the sample. Here, we used a modified version of a testing machine that was originally developed for the analysis of historical paper (Lichtblau, Dirk Andreas. 2007. “Die ergänzende Messung der Nullreißlänge mit der Zugprüfmaschine als Alternative zu Einzweckgeräten.” Paper presented at the First International Zwick Roell Symposium für Prüfungen an Papier und Wellpappe, Ulm.). We used a zwickiLine Z0.5 TS material testing machine equipped with an Xforce precision force sensor (nominal force = 500 N), pneumatic sample holders, and an adjustment system for a highly precise arrangement and guidance of the specimens. Figure 16.1 shows the front view of the four special clamps for the zero-span tensile strength, which are arranged in pairs at a vertical distance of 0.1 mm.
In order to apply this technology to yarn samples and use it as a standard method for the study of paintings, it was modified for this project. The basis for the study is provided by the standards listed in table 16.1, from which relevant aspects were adopted. The following criteria were developed:
| Standard | Content | Published |
|---|---|---|
| TAPPI T 231 cm-07 | Zero-Span Breaking Strength of Pulp (Dry Zero-Span Tensile) | 2007 |
| ISO 2062 | Textiles—Yarns from Packages—Determination of Single-End Breaking Force and Elongation at Break Using Constant Rate of Extension (CRE) Tester (ISO 2062:2009) | 2009 |
| ISO 2060 | Textiles—Yarns from Packages—Determination of Linear Density (Mass per Unit Length) by the Skein Method | 1994 |
-
Theoretically, three different types of samples were conceivable: twisted yarns, untwisted yarns, and single fibers. However, in the case of twisted yarn, premature damage of the sample can be excluded. In addition, for this configuration, a maximal correlation of the results with the strength of the canvas is expected.
-
The minimum sample length was determined considering the following points: The sample length should be as short as possible to (potentially) be applicable to original canvases. Samples needed to be long enough to be reproducibly held by the clamps, which require a 2.1 mm operational distance. Hence, a sample length of 5.0 mm for each sample is necessary for the vertical application.
-
A standardized technique for the vertical application of the sample into the clamps with a magnetic clip was developed. Here, the sample was positioned vertically on a metal ruler and fixed inside the clip using an elastic magnet. Then the sample was applied into the clamps of the machine.
-
Thread slippage of the yarn section should be avoided.
-
The rupture of the yarn section had to be complete and homogeneous.
-
The measurements should also be applicable to samples of original canvases.
-
The measurements should be reproducible within an acceptable error range.
-
The stress-strain curves should be analyzable until the yarn breaks.
-
The time effort for the whole experiment should be minimized.
To develop the standard protocol, test measurements were conducted on a new fabric using the above criteria. The use of an identical fabric ensured the comparability of the different settings of the testing machine. The resulting standard protocol is outlined in table 16.2, which shows the final parameters that allowed us to fulfill our criteria.
| Brief description | A yarn section is manually inserted into the upper clamp using an appropriate clip and fixed in position by closing the lower clamp. For measurement, the sample is stretched with constant deformation speed until break, and the maximum tensile strength and maximum tensile strength elongation are recorded. |
| Sample | Yarn section (twisted). |
| Sample length | 5.0 mm |
| Clamps | After TAPPI T 231 cm-07. |
| Clamp distance | 0.1 mm |
| Contact pressure | 6.0 mbar |
| Speed of measurement | 0.1 mm/min. |
| Preload | None |
| Sample condition | Diameter as homogeneous as possible. |
| Sample preparation | For samples of original paintings, primer and paint residuals must be excluded and sizing reduced. |
| Adjusting to the standard climate | After ISO 139. |
| Diameter-normalized maximum tensile strength | After ISO 2060. |
| Number of measurements per point | 12 (minimum). |
| Number of measurements used for calculation | Number of measurements per point minus 2 (highest and lowest values excluded). |
| Statistical analysis | After DIN 53804-1. |
For conducting a measurement for one canvas, the following steps were performed:
-
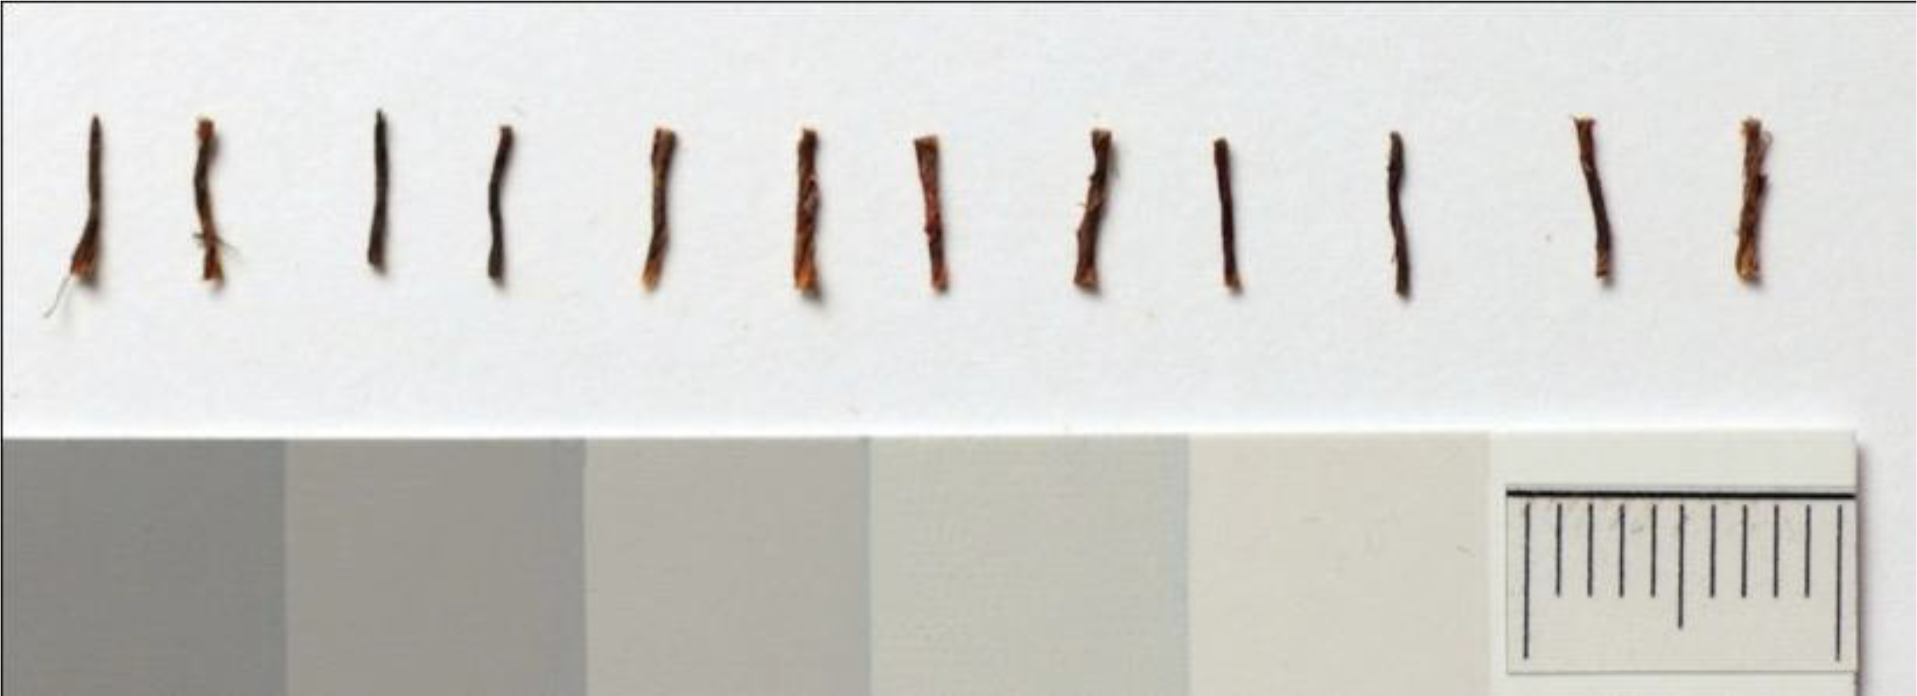
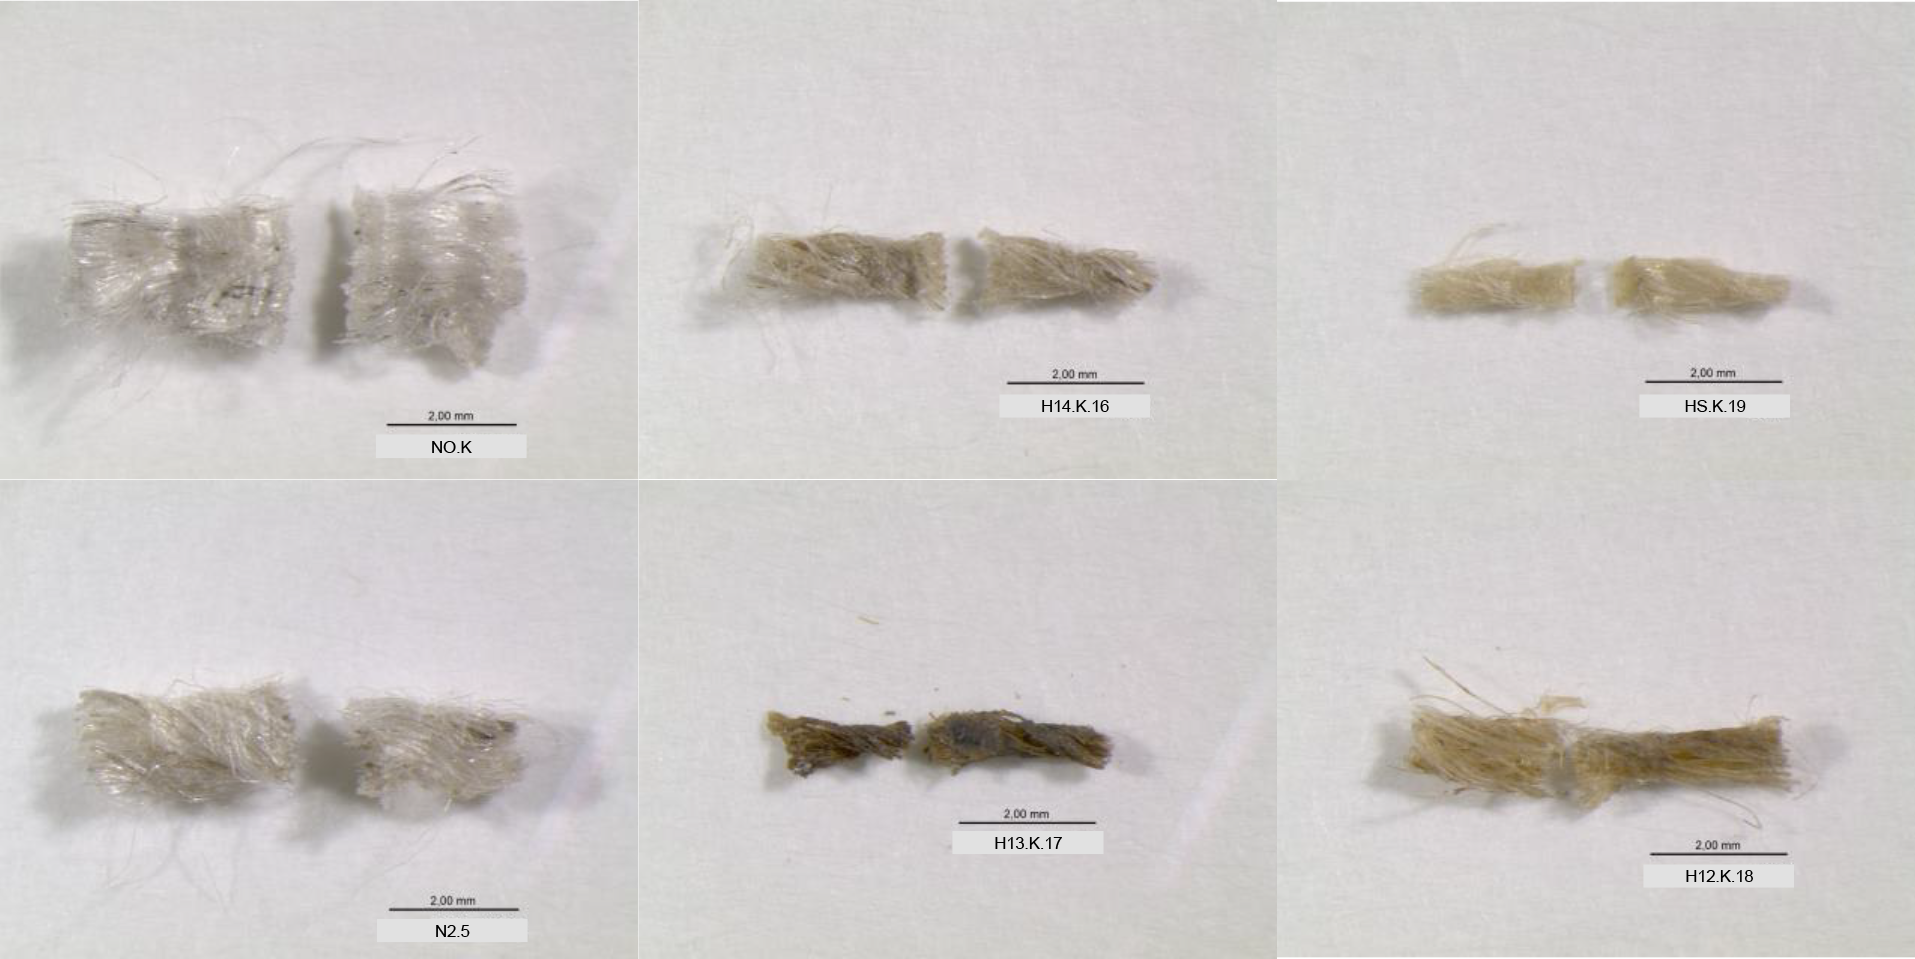
After determining the sample mass and length, the tensile strength was measured on twelve yarn sections (5 mm each) following the standard protocol (fig. 16.2).
Figure 16.2 (a) Yarn sections (5.0 mm long) derived from one original canvas. (b) Different representative ruptured samples from artificially aged fabrics and original canvases after zero-span tensile strength measurement. Images: Theresa A. Bräunig -
To obtain a statistically significant result for the tensile strength for one canvas, it was necessary to measure twelve yarn sections with 5 mm length each. From the maximum tensile load measured in newtons, the diameter-normalized maximal tensile strength ( fH) was calculated following fH = F/Tt with Tt = fineness (in units of tex) in order to compare yarns of different fineness (Reumann, Ralf-Dieter. 2000. “Mechanisches Formänderungsverhalten textiler Materialien.” In Prüfverfahren in der Textil- und Bekleidungstechnik, edited by Ralf-Dieter Reumann, 57–125. New York: Springer-Verlag.).
-
To determine the fineness, the mass was divided by the length of the yarn (Hartwig, Thomas, and Ralf-Dieter Reumann. 2000. “Feinheit.” In Prüfverfahren in der Textil- und Bekleidungstechnik, edited by Ralf-Dieter Reumann, 250–59. Berlin: Springer-Verlag.).
-
For the final data analysis, the highest and the lowest values were excluded, and the average and the corresponding standard deviation were calculated from the remaining ten values.
Determination of the Limiting Viscosity Number (Staudinger Index) Using Capillary Viscometry
The average degree of polymerization has been established in the field of conservation research to describe the degree of decomposition and the molecular condition of cellulose (Stoll, Manfred, and Dietrich Fengel. 1981. “Untersuchungen über die Alterung von Cellulose anhand von altägyptischen Leinenproben.” Das Papier 35: 178–85.). The degree of polymerization is calculated based on the experimentally determined limiting viscosity number. However, for this calculation different methods have been described, leading to different results (Stoll, Manfred, and Dietrich Fengel. 1981. “Untersuchungen über die Alterung von Cellulose anhand von altägyptischen Leinenproben.” Das Papier 35: 178–85.). Thus, in order to directly compare results from different studies, the standard DIN 54 270 part 1 suggests omitting the calculation of the degree of polymerization and instead using the limiting viscosity number as the reference value (DIN (Deutsches Institut für Normung). 1976. Prüfung von Textilien: Bestimmung der Grenzviskosität von Cellulosen, Grundlagen. 54 270 part 1, Ausgabe 1976-09. Berlin: DIN.). Just like the degree of polymerization, the limiting viscosity number increases as the chain length of the cellulose molecules increases.
The intrinsic viscosity of all yarn samples was determined using capillary viscometry. This method allows investigation of original sample material as well, since the necessary sample amount is less than 15 mg. All experiments were performed according to the standard DIN 54 270 part 3 (DIN (Deutsches Institut für Normung). 1977. Prüfung von Textilien: Bestimmung der Grenzviskosität von Cellulosen, EWNNmod(NaCl) Verfahren. 54 270 part 3, Ausgabe 1977-08. Berlin: DIN.), with minor modifications (Bräunig, Theresa, Anna von Reden, Dirk Andreas Lichtblau, and Christoph Herm. 2016. “Eine neue Technik zur Bestimmung der Festigkeit von textilen Bildträgern und ihr Zusammenhang mit dem Polymerisationsgrad der Cellulose.” Zeitschrift für Kunsttechnologie und Konservierung 30, no. 2: 351–62.). The basic principle is as follows: the yarn sample is disassembled into single fibers, then dissolved in alkaline iron tartrate system (in German EWNNmod(NaCl)), and the viscosity of the resulting solution is determined using a Micro-Ubbelohde viscometer. The time required for a defined volume of a test liquid to pass a defined distance in a capillary of a known diameter is used to calculate the kinematic viscosity of that liquid. The dissolved cellulose sample is inserted into the viscometer, aspirated, and then the flow time back through the device caused by gravity is measured (twice per sample) with two independent fillings. The result given here is the mean value of the two measurements.
Sample Material and Preparation
Overall, seventeen different flax fabrics were analyzed: one new fabric, with two additional levels of artificial aging, and fourteen canvas samples from original paintings. Artificial aging was achieved by exposure to light in a Xenotest (42 W/m², filter: < 320 nm, 35°C and 30% RH), followed by a temperature increase (70°C) and cyclically alternating humidity (from 30% to 80% RH over twelve hours). The samples from original paintings—dating from the sixteenth to the twentieth century—originated from paintings that were processed in the framework of teaching at Dresden University of Fine Arts. The choice of the paintings was driven by the aim of reflecting a broad spectrum of aging. All paintings were generally untreated and had not been stored in a constant climate.
From the new and artificially aged fabrics, samples of warp and weft were taken from the middle of the fabric. The position and thread direction of the samples from the original canvases differed depending on the condition of each individual painting. For preparation, the samples from the original canvases were soaked in a bath to increase the homogeneity of the starting material. The resulting coloring of the extract showed that dirt, small particles, and (most likely) the sizing could be dissolved. Then the yarns were cut into twelve sections of 5 mm each. To maximize the comparability of the results from the two different methods, identical samples were first used for the tensile strength measurement and then dissolved for the capillary viscometry experiment.
Results
The results of the tensile strength measurements confirm that the standard protocol we developed is applicable without any limitation to all yarn samples tested. Figure 16.3a shows the average of the diameter-normalized maximum tensile strength ( fH in N/tex) with the corresponding standard deviation for all measured samples. All results for the tensile strength lie between 0.000120 and 0.02744 N/tex. The new fabric before and after artificial aging shows the highest values, thus these samples cover the range of weak aging. The samples from the original canvases are found in the range of middle and show strong aging, making it apparent that the artificial aging was not sufficient to reflect the values of the original samples. For the artificially aged fabrics, the warps were generally more stable than the wefts—either those that were unaged or those that had been aged for shorter periods.
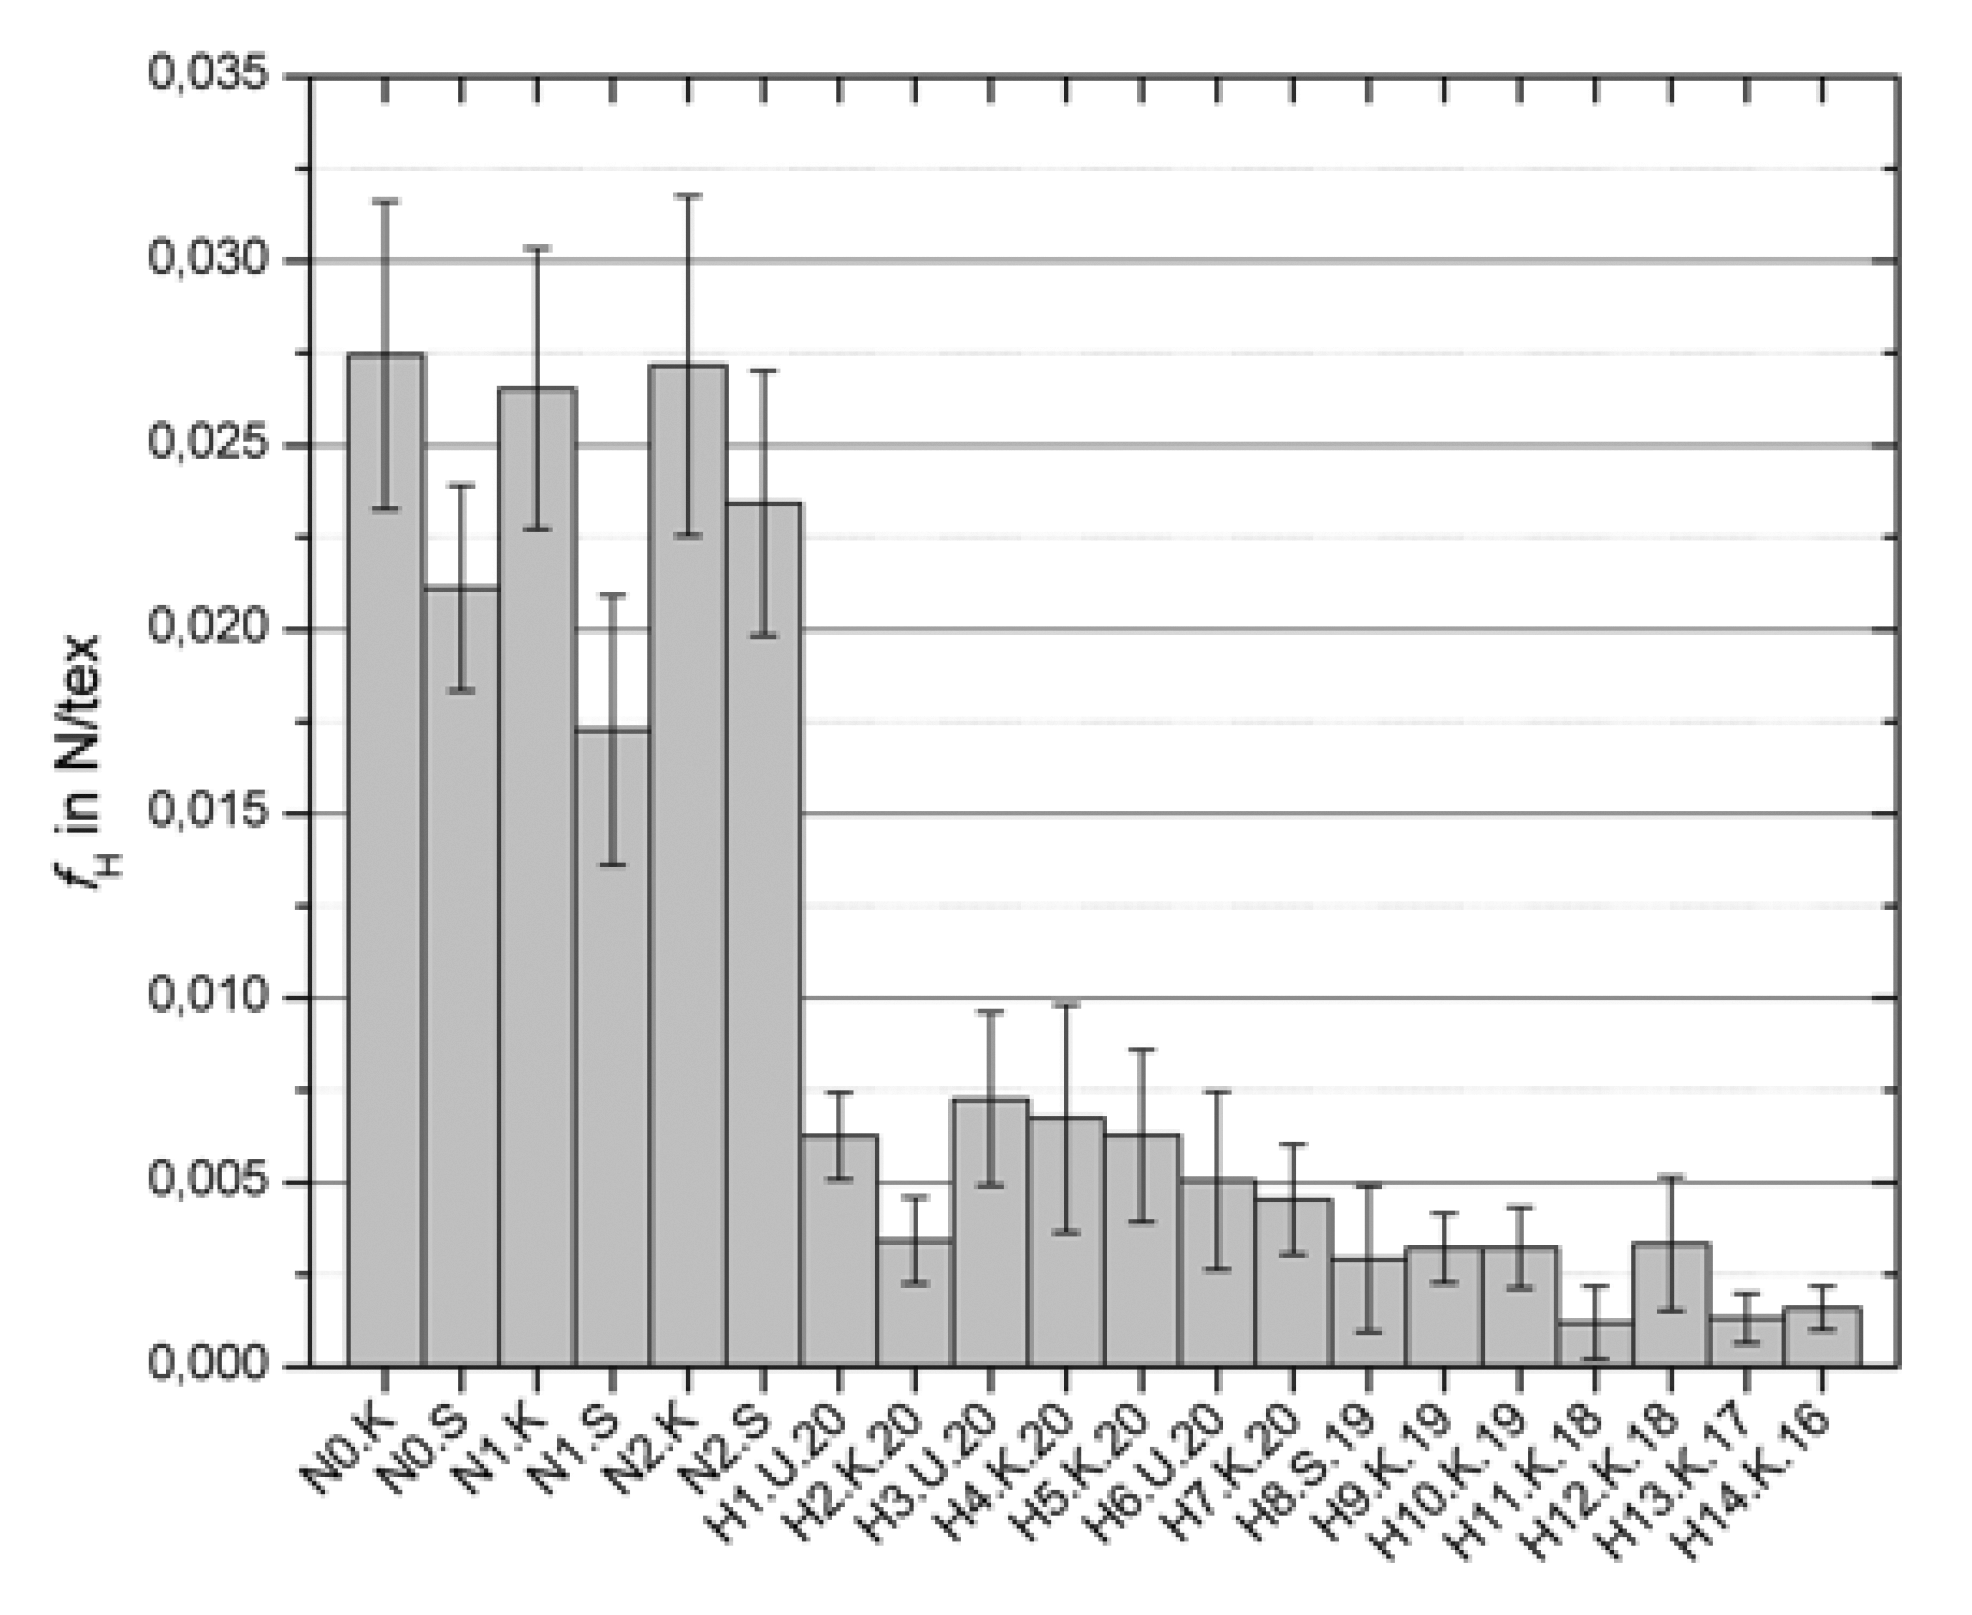
For the historical yarn samples from the nineteenth and twentieth centuries (H1U20–H10K19), the strength decreases with increasing age. In the region with the lowest strength, measured on the samples from the sixteenth to eighteenth century, the strength does not correlate with the age. Probably, the strength of these samples is more strongly influenced by further factors, such as aging conditions, pretreatment, and painting technique.
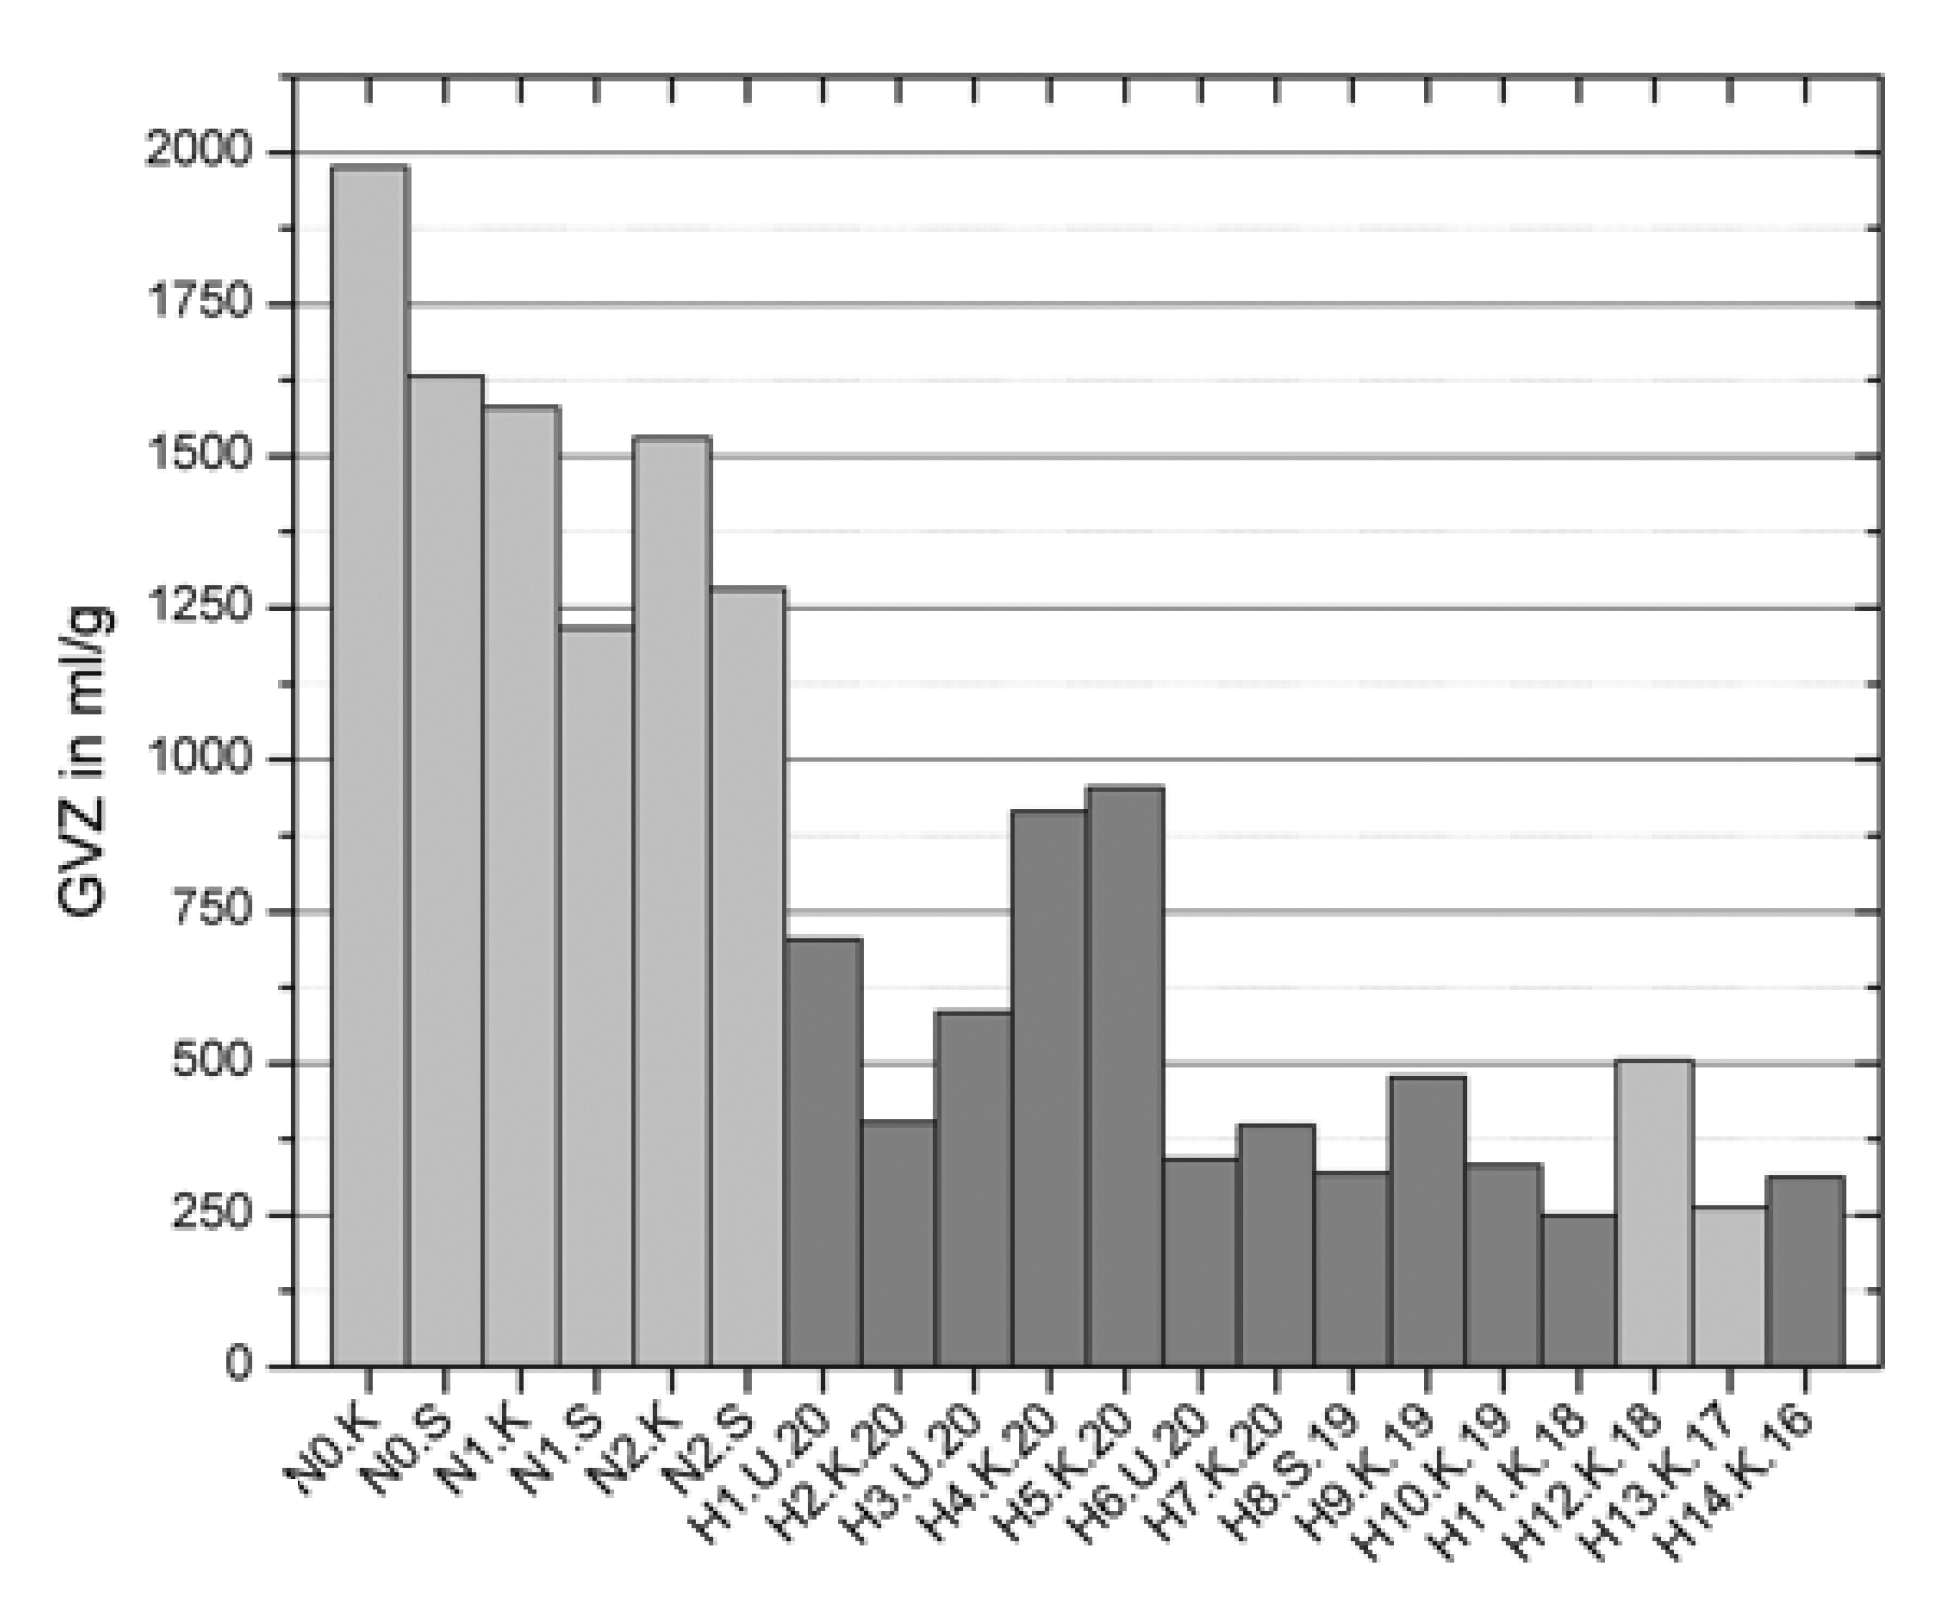
Figure 16.3b shows the results of the capillary viscometry experiments. The analyzed yarn samples cover a broad spectrum of limiting viscosity numbers (GVZ in units of ml/g), which, in contrast to the diameter-normalized maximum tensile strength values ( fH; see fig. 16.3a), show a smaller gap between the artificially and historically aged samples. Overall, the values lie between 250 and 1976 ml/g. High values were obtained from the new and artificially aged samples. In line with the results of tensile strength (see fig. 16.3a), the warps show higher values than the wefts. This phenomenon can be explained by the different yarn quality of the two groups. While the warps in these samples consisted of doubling folded yarns with long single fibers, the wefts were yarns with short single fibers.
Surprisingly, we observed an anomaly for the artificially aged wefts that is consistent throughout both methods: the wefts that were aged longer show slightly higher values than wefts aged for shorter periods. Since this phenomenon appears with both methods, the result seems to be sample specific. This anomaly could be caused by the inhomogeneity of the material. In comparison, the historical samples generally show lower values. For technical reasons, the viscosity measurements were conducted at two different temperatures (18°C and 19°C, shown in fig. 16.3b in light and dark gray, respectively).
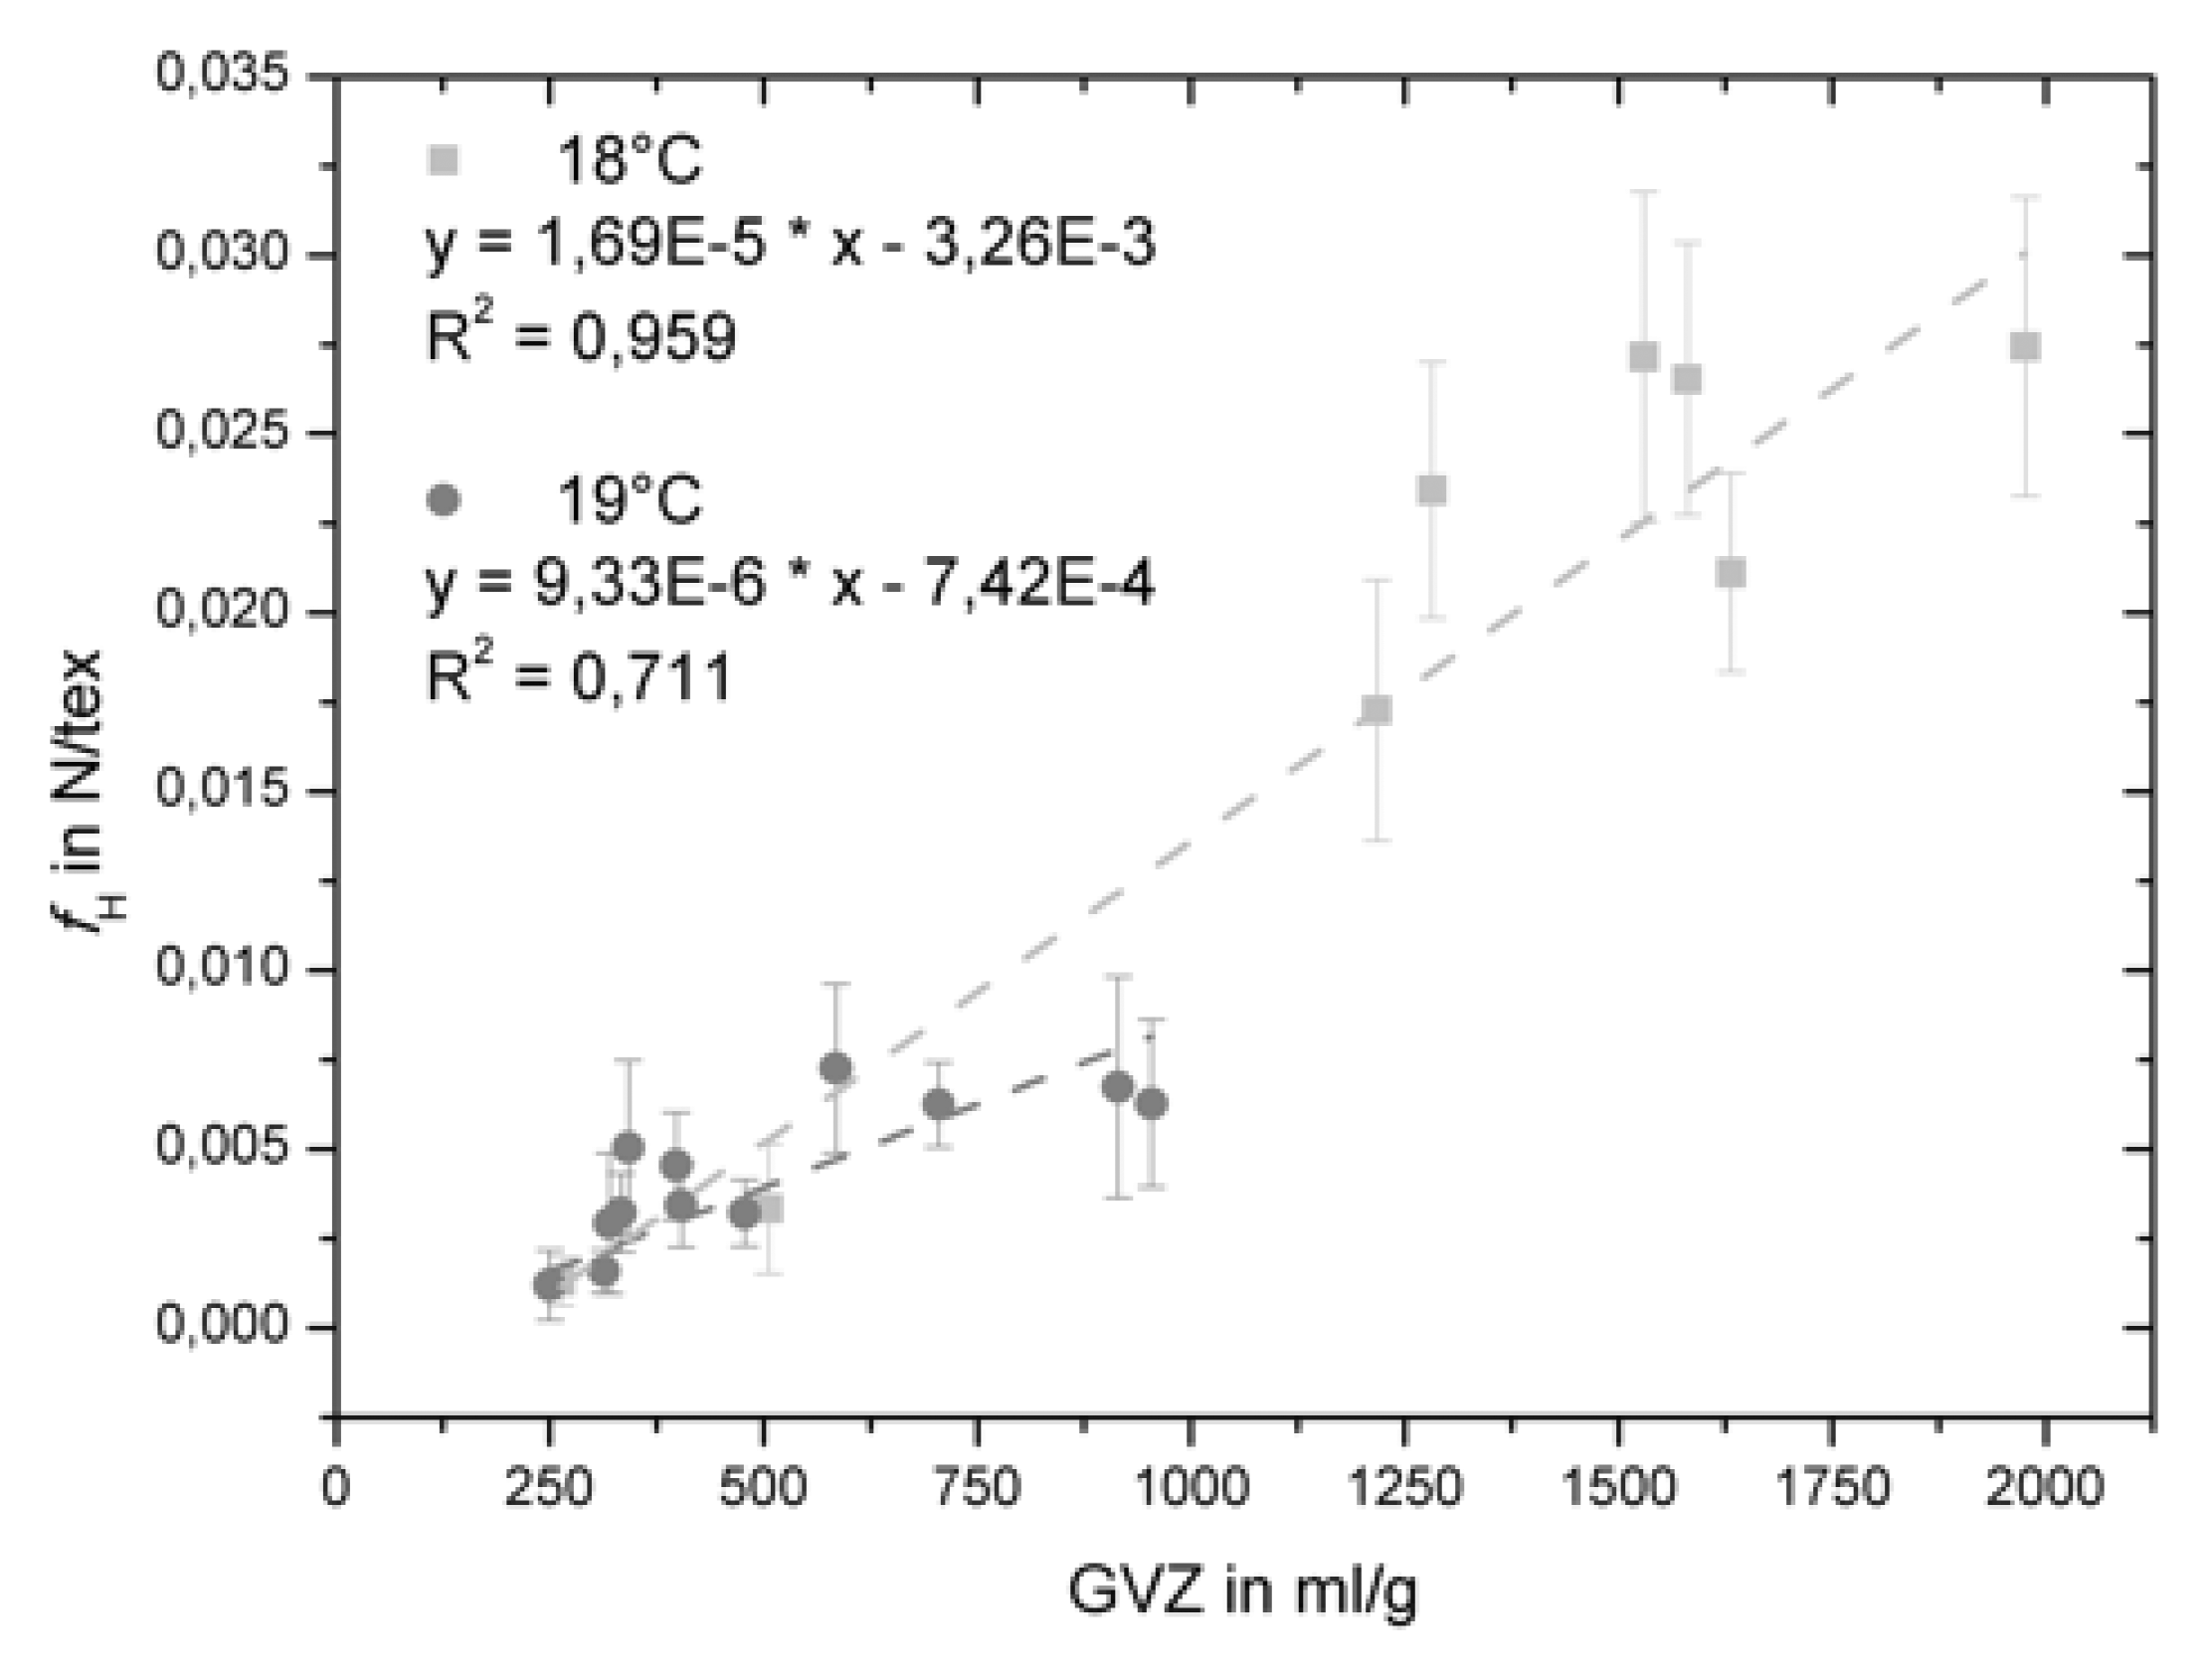
The correlation of the data determined by the two different methods is plotted in figure 16.4: the degree of polymerization of the cellulose, represented by the limiting viscosity number (GVZ), and the strength of the tested yarn samples ( fH), measured by our newly developed protocol. Due to the strong dependence of the viscosity measurement on temperature, the experiments at 18°C and 19°C are plotted separately. For both temperatures, a clear correlation of the limiting viscosity number with the diameter-normalized maximum tensile strength can be found. The data points can be grouped into two separate populations: low strength ( fH < 0.008 N/tex), consisting of the naturally aged samples, and high strength ( fH > 0.017 N/tex), consisting of new and artificially aged samples. In summary, a linear correlation is observed over the whole data set.
In contrast to capillary viscometry, the tensile strength of the yarn measured with zero-span distance still could be influenced by yarn geometry. In addition, for the historical samples, remaining material such as a binding agent may influence the tensile strength. For the low values, the results of both methods do not completely align with the dating of the samples. In other words, a canvas from the sixteenth century may show a higher tensile strength than a canvas from the seventeenth century. This shows that the dating by itself is not sufficient to draw a conclusion on the tensile strength. The pretreatments of the canvases and the respective conditions under which the paintings were stored may have a significant influence on their material state.
Comparing our tensile strength results and the empirical impression of the canvases reveals an interesting finding. Generally, the lowest values for intrinsic viscosity and strength reflected the empirical impression of the fragility of the corresponding canvases. In these cases, the canvases were obviously brittle. In contrast, within the major range of the values, for all nonaged and aged samples, no correlation between the values and the empirical impression could be observed. There are no explicit empirically identifiable characteristics that point toward a medium or even a higher loss of tensile strength. An empirical evaluation of the canvas stability is only possible when it already reached a state of fragility that leads to breaking or cracking at low application of a force, such as during handling. These results suggest that an empirical assessment as a basis for a conservational treatment has only limited scope and that an exact method to determine the stability of the canvas is needed.
Conclusion and Outlook
In this study, we developed a novel, standard protocol for the determination of the zero-span tensile strength of yarn sections. It delivers, for the first time, trustworthy results for the strength of the cellulose because the influence of the yarn geometry is reduced to a minimum. Compared to capillary viscometry, the zero-span tensile strength measurement is easier and faster to conduct. The necessary amount of sample is similar, and the time effort is reduced. For example, thirty tensile strength measurements can be conducted in an hour.
A direct correlation of the intrinsic viscosity with the tensile strength of historical canvases could be established. It could be confirmed that the mechanical strength of yarn depends directly on the degree of degradation of cellulose. The mechanical properties are directly measured, as opposed to determining the degree of polymerization by the intrinsic viscosity of the dissolved material. Hence, this method has great potential to mechanically evaluate the degradation of a canvas as a valuable alternative to viscometry.
Following up on our studies, the measurement of lower strength values would be of value. Therefore, the use of significantly finer microstrength sensors is recommended. By increasing the number of investigated paintings, we may be able to obtain a broader set of comparative data.
In comparison to the current standard techniques of tensile strength determination, the required sample material could be significantly reduced to 60 mm of fiber per canvas in total. Nevertheless, ethically, such an intervention represents a significant decision for an original painting. Thus, in its current state, this method is best suited for scientific research. For its application as a standard method for original paintings, further optimization and reduction of sample requirements are needed. Furthermore, it must be taken into account that, depending on the painting, the samples are usually taken from the tacking margin and not from the center of the canvas. Due to differences in degradation mechanisms in tensioned and nontensioned canvases, different results can be expected in the two areas (Von Reden, Anna. 2018. “Studien zum hygrischen Verhalten gealterter Leinwände (Studies on the Hygric Behavior of Aged Canvases.” PhD diss., Dresden University of Fine Arts. https://nbn-resolving.org/urn:nbn:de:bsz:14-qucosa2-340450.).
The measurement of zero-span tensile strength serves the overarching goal of being able to reproducibly extrapolate from the strength of the measured position to the strength of the whole original canvas. For this, the influence of yarn and fabric geometry on canvas strength must be investigated. By knowing these relationships, an assessment of the strength of the canvas should be possible, which can then serve as a basis for decisions on stabilization treatments, such as tear mending, strip-lining, or lining, which are of utmost relevance to the conservator.
Acknowledgments
We would like to thank Dr. Ursula Haller from Dresden University of Fine Arts for providing samples from original paintings, and Jens Danneberg for support with tensile testing.