Paintings on canvas are composite structures with mechanical properties that are difficult to characterize due to many complicated issues: the wide range of artists materials and techniques, which vary by region and time; the changing properties of materials with age and environmental exposure; and the addition of conservation treatments. Paintings are also composed of viscoelastic materials, which means that properties such as stiffness and extensibility are time and temperature dependent. This large matrix of variables makes it impossible to characterize the behavior of all paintings in the same way that an engineer might describe a distinct structure under a narrow window of conditions and boundary constraints. Valuable information is instead derived from materials testing of representative samples, development of simplified models, and expert knowledge from past successes and failures. As a result of the complexity, heuristics is often applied in conservation treatments. This paper provides a generalized overview of the mechanical behavior of paintings in tension and describes trends that help to refine the heuristics approach. The discussion is presented in the context of a viscoelastic (time-dependent) material model rather than elastic-plastic in order to highlight key concepts.
2. Applied Mechanics and the Structural Treatment of Paintings on Canvas
- Eric Hagan, Senior Conservation Scientist, Canadian Conservation Institute
Introduction
Those studying the mechanical behavior of artists paints and painting structures will likely begin with the general elastic-plastic stress-strain relationships often discussed in introductory engineering texts. A classic diagram will label elastic modulus, yield point, ultimate tensile strength, and failure strain from a simple tensile test. The concepts then become incredibly complex when delving deeper into the response of polymeric materials under varying conditions. This is particularly true for artists paints when considering the influence of temperature, rate of deformation, moisture content, additives to the polymer matrix, and many other factors. To accurately characterize the small-strain behavior of paint films over a wide range of conditions, it often necessary to consider a linear viscoelastic material model (Ferry, John D. 1980. Viscoelastic Properties of Polymers. 3rd ed. New York: John Wiley & Sons.). Describing the large-strain response may require adding hyperelasticity (Treloar, Leslie Ronald George. 1975. The Physics of Rubber Elasticity. 3rd ed. Oxford: Clarendon Press.) for an extension to a nonlinear viscoelastic material (Christensen, Richard. 1982. Theory of Viscoelasticity: An Introduction. 2nd ed. (New York: Academic Press).). An example of this approach was developed for acrylic (latex) artists paints containing titanium dioxide (Hagan, Eric W. S., Maria N. Charalambides, Christina T. Young, Thomas J. S. Learner, and Stephen Hackney. 2009. “Tensile Properties of Latex Paint Films with TiO2 Pigment,” Mechanics of Time-Dependent Materials 13, no. 2: 149–61. https://doi.org/10.1007/s11043-009-9076-y.), which provided parameters for finite element analysis in software such as Abaqus. Calibrating such a model—even for one material—is no easy task. It involves many tests and numerical iteration to solve the best fit parameters to experimental data, and simplifying assumptions still remain.
When pigment particles are included in the polymer matrix of a paint film, the material becomes a particle-filled composite with a viscoelastic matrix. Stiffness enhancement as a function of particle volume concentration is described in many micromechanics models; however, most give little consideration to geometry effects. The Mori-Tanaka theory is particularly useful since it considers the influence of particle shape and orientation in addition to volume fraction (Tandon, G. P., and G. J. Weng. 1986. “Average Stress in the Matrix and Effective Moduli of Randomly Oriented Composites.” Composites Science and Technology 27, no. 2: 111–32. https://doi.org/10.1016/0266-3538(86)90067-9.). Clements and Mas extended this theory from an elastic to linear viscoelastic matrix for small-strain modeling (Clements, B. E., and E. M. Mas. 2001. “Dynamic Mechanical Behavior of Filled Polymers. I. Theoretical Developments.” Journal of Applied Physics 90, no. 11: 5522–34. https://doi.org/10.1063/1.1412843.). The effects of particle shape and concentration were highlighted for artists acrylic paints using kaolin, calcium carbonate (aragonite), and titanium dioxide as an inorganic phase in a recent study (Hagan, Eric W. S., Maria N. Charalambides, Christina T. Young, Thomas J. S. Learner, and Stephen Hackney. 2011. “Influence of the Inorganic Phase Concentration and Geometry on the Viscoelastic Properties of Latex Coatings through the Glass-Transition.” Polymer 52, no. 7: 1662–73. https://doi.org/10.1016/j.polymer.2011.01.060.). From this research, it is easy to imagine that the properties of a paint layer may be different along a brushstroke relative to the transverse direction, due to the alignment of pigment particles with an aspect ratio not equal to 1. The composite structure of a painting on canvas adds further complexity given the layering of different materials and boundary conditions at the stretcher. Common treatment approaches, such as linings, add further variables.
It is impractical to think that we can precisely understand the mechanical behavior of paintings with so many influencing factors, which additionally include chemical effects of the aging process, the physical aging of polymers (Struik, L. C. E. 1980. Physical Ageing in Amorphous Polymers and Other Materials. Amsterdam: Elsevier.), load cycling, fracture, and delamination (Tantideeravit, D., M. N. Charalambidesa, D. S. Balinta, and C. R. T. Young. 2013. “Prediction of Delamination in Multilayer Artist Paints under Low Amplitude Fatigue Loading.” Engineering Fracture Mechanics 112–13: 41–57. https://doi.org/10.1016/j.engfracmech.2013.09.011.). While researchers work to better understand and model these materials for risk analysis, it is important to use the best information available in a heuristic approach to resolving practical problems of the moment. Waller and Michalski emphasized the value of heuristics in preventative conservation:
A fully rational approach would require that all possibly relevant information be obtained and used in arriving at a decision or evaluation. The cost of—and time required for—a fully rational decision is infinite. Instead, a conservator evaluates, using heuristics (simple rules of thumb or intuition), whether there is an advantage in seeking more information before deciding whether a particular issue, such as a risk to a collection, is significant or not. (Waller, Robert, and Stefan Michalski. 2004. “Effective Preservation: From Reaction to Prediction.” The Getty Conservation Institute Newsletter 19, no. 1: 4–9.)
In “Toward a Definition of the Engineering Method,” Koen defines heuristics as “anything that provides a plausible aid or direction in the solution of a problem but is in the final analysis unjustified, incapable of justification and fallible. It is anything that is used to guide, discover and reveal a possible, but not necessarily, correct way to solve a problem” (Koen, Billy V. 1988. “Toward a Definition of the Engineering Method,” European Journal of Engineering Education 13, no. 3: 307–15. https://www.tandfonline.com/doi/abs/10.1080/03043798808939429.). An important comparison is given to the different approaches of the scientific and engineering methods. Koen also states that “the engineering method is the use of engineering heuristics to cause the best change in a poorly understood situation within the available resources” (Koen, Billy V. 1988. “Toward a Definition of the Engineering Method,” European Journal of Engineering Education 13, no. 3: 307–15. https://www.tandfonline.com/doi/abs/10.1080/03043798808939429.). There is clearly a similarity between the work of a heritage conservation professional and an engineer, with respect to problem-solving under challenging circumstances with many unknowns.
A pertinent example of the engineering method is found in the renowned body of research by Mecklenburg related to the mechanics of artists materials and the effects of the museum environment. In the proceedings of the 1991 Art in Transit meeting, Mecklenburg and Tumosa present findings that highlight the tensile properties of artists paints as a function of strain rate (Mecklenburg, Marion F., and Charles S. Tumosa. 1991a. “Introduction into the Mechanical Behavior of Paintings under Rapid Loading Conditions.” In Art in Transit: Studies in the Transport of Paintings, edited by Marion F. Mecklenburg. Washington, DC: National Gallery of Art.). In contrast, subsequent research gives descriptions of material behavior that use an elastic-plastic (time-independent) model (Mecklenburg, Marion F. 2005. “The Structure of Canvas Supported Paintings.” In Interim Meeting: International Conference on Painting Conservation: Canvases: Behaviour, Deterioration & Treatment, edited by M. C. Agusti, L. F. López, S. M. Rey, and V. G. Blay, 119–55. Valencia: Universidad Politècnica de València.). Strain rate is fixed to a constant value in mechanical tests to generate timely and practical information on the effects of the museum environment without the burden of viscoelastic theory.
The aim of this paper is to revisit some key concepts in the time-dependent mechanical behavior of paintings, as a supplement to fundamental knowledge of mechanics. The concepts relate to many of the treatment methods used in practice where material behavior is altered by changing different parameters. Detailed theory and test results are presented elsewhere; therefore, the focus is on generalized trends for clarity. A brief review of lining effects on stiffness and stress relaxation of painting is also provided to complement a more in-depth discussion regarding the Canadian Conservation Institute (CCI) Lining Project (Daly Hartin, Debra, Eric Hagan, Stefan Michalski, and Mylène Choquette. 2011. “CCI Lining Project: Testing of Lined Model Paintings from Fractions of a Second to Decades.” In ICOM-CC Lisbon 2011: Preprints, 16th Triennial Conference, Lisbon, 19–23 September 2011, edited by Janet Bridgland and Catherine Antomarchi, paper 1309, 288–96. Almada, Portugal: Critério Produção Grafica; Paris: ICOM Committee for Conservation.).
Mechanical Response of Paintings in Tension
Stress-Strain Curves
A stress-strain curve is derived from a simple tensile test, and it is often used to characterize the mechanical properties of painting materials. Force and displacement measurements are converted to stress and strain in order to remove the effects of sample geometry. The initial slope of a stress-strain curve in uniaxial tension is a measure of stiffness called the modulus of elasticity, E, or Young’s modulus. Experiments in shear mode define the shear modulus, while hydrostatic pressure gives the bulk modulus. For a viscoelastic material, these elastic moduli are time dependent, and the stress-strain relationship is nonlinear due to polymer relaxation during the test. Figure 2.1 shows stress-strain curves from a series of tensile tests performed on free films of an artists oil paint. The results highlight that the modulus decreases with higher temperature and reduced rate of deformation, while the failure strain increases. Despite this trend, there is no simple relationship between stiffness and failure strain for materials in general. A material may be stiff and brittle or compliant and brittle.
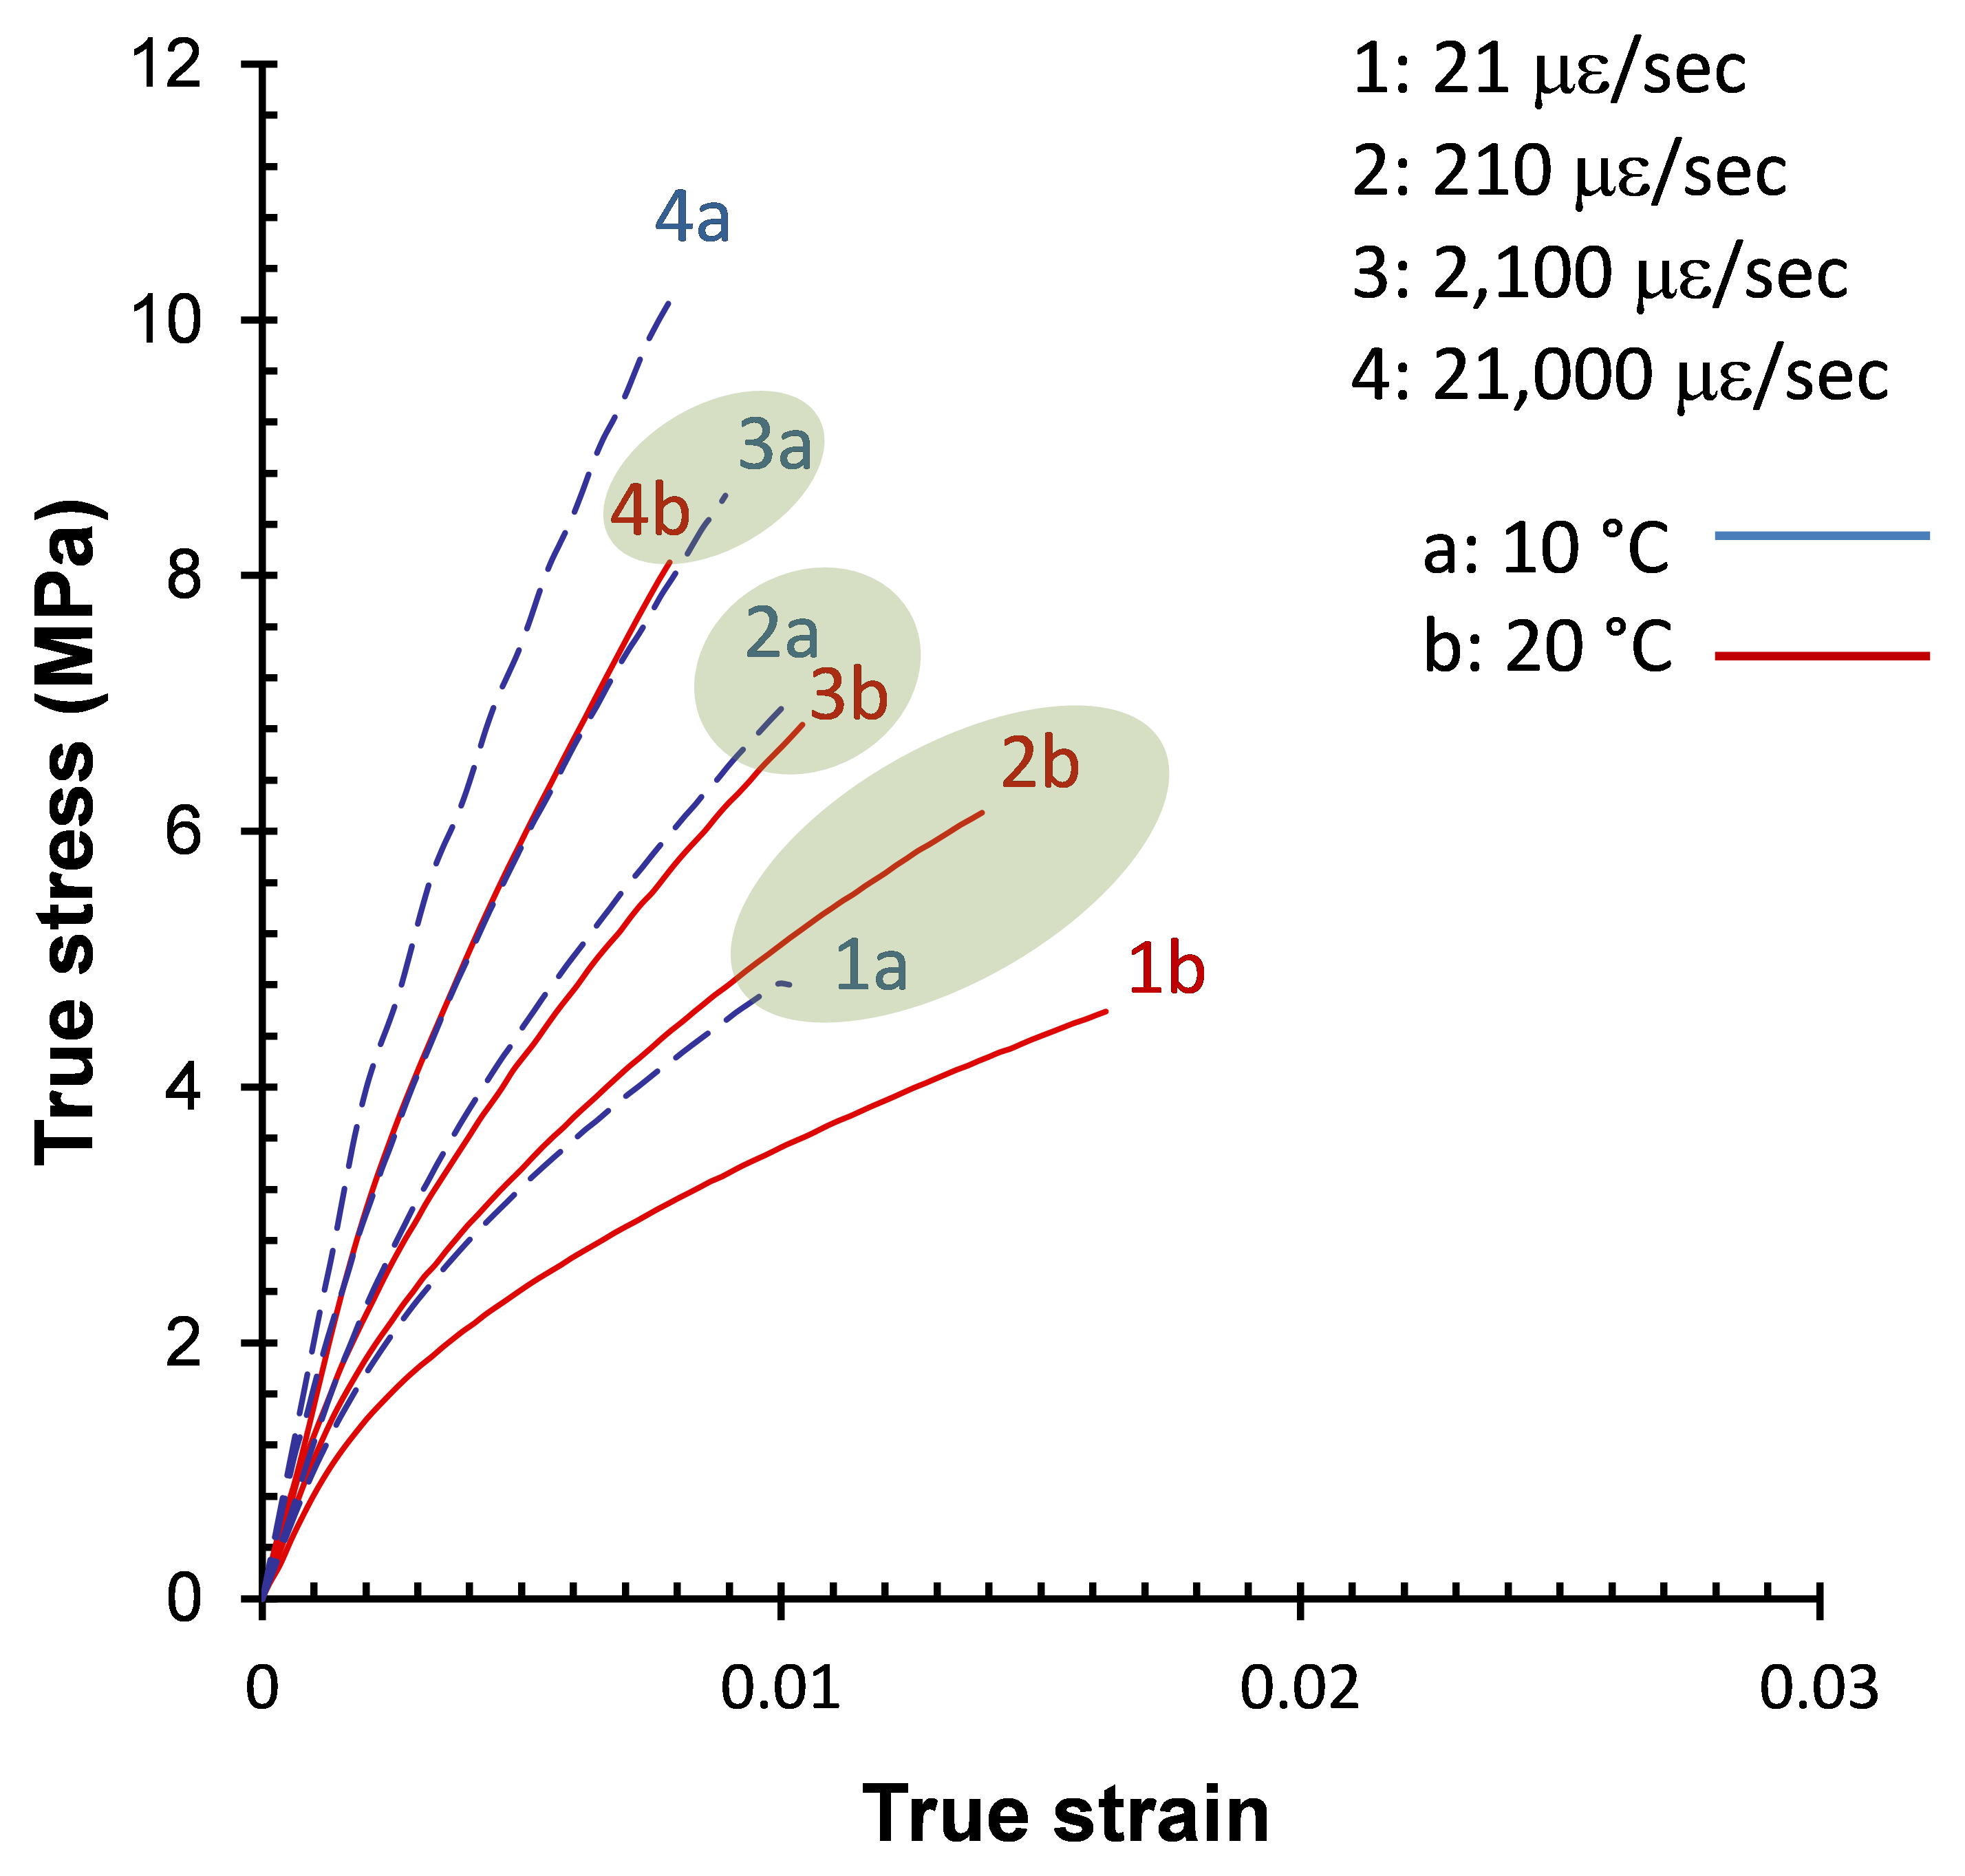
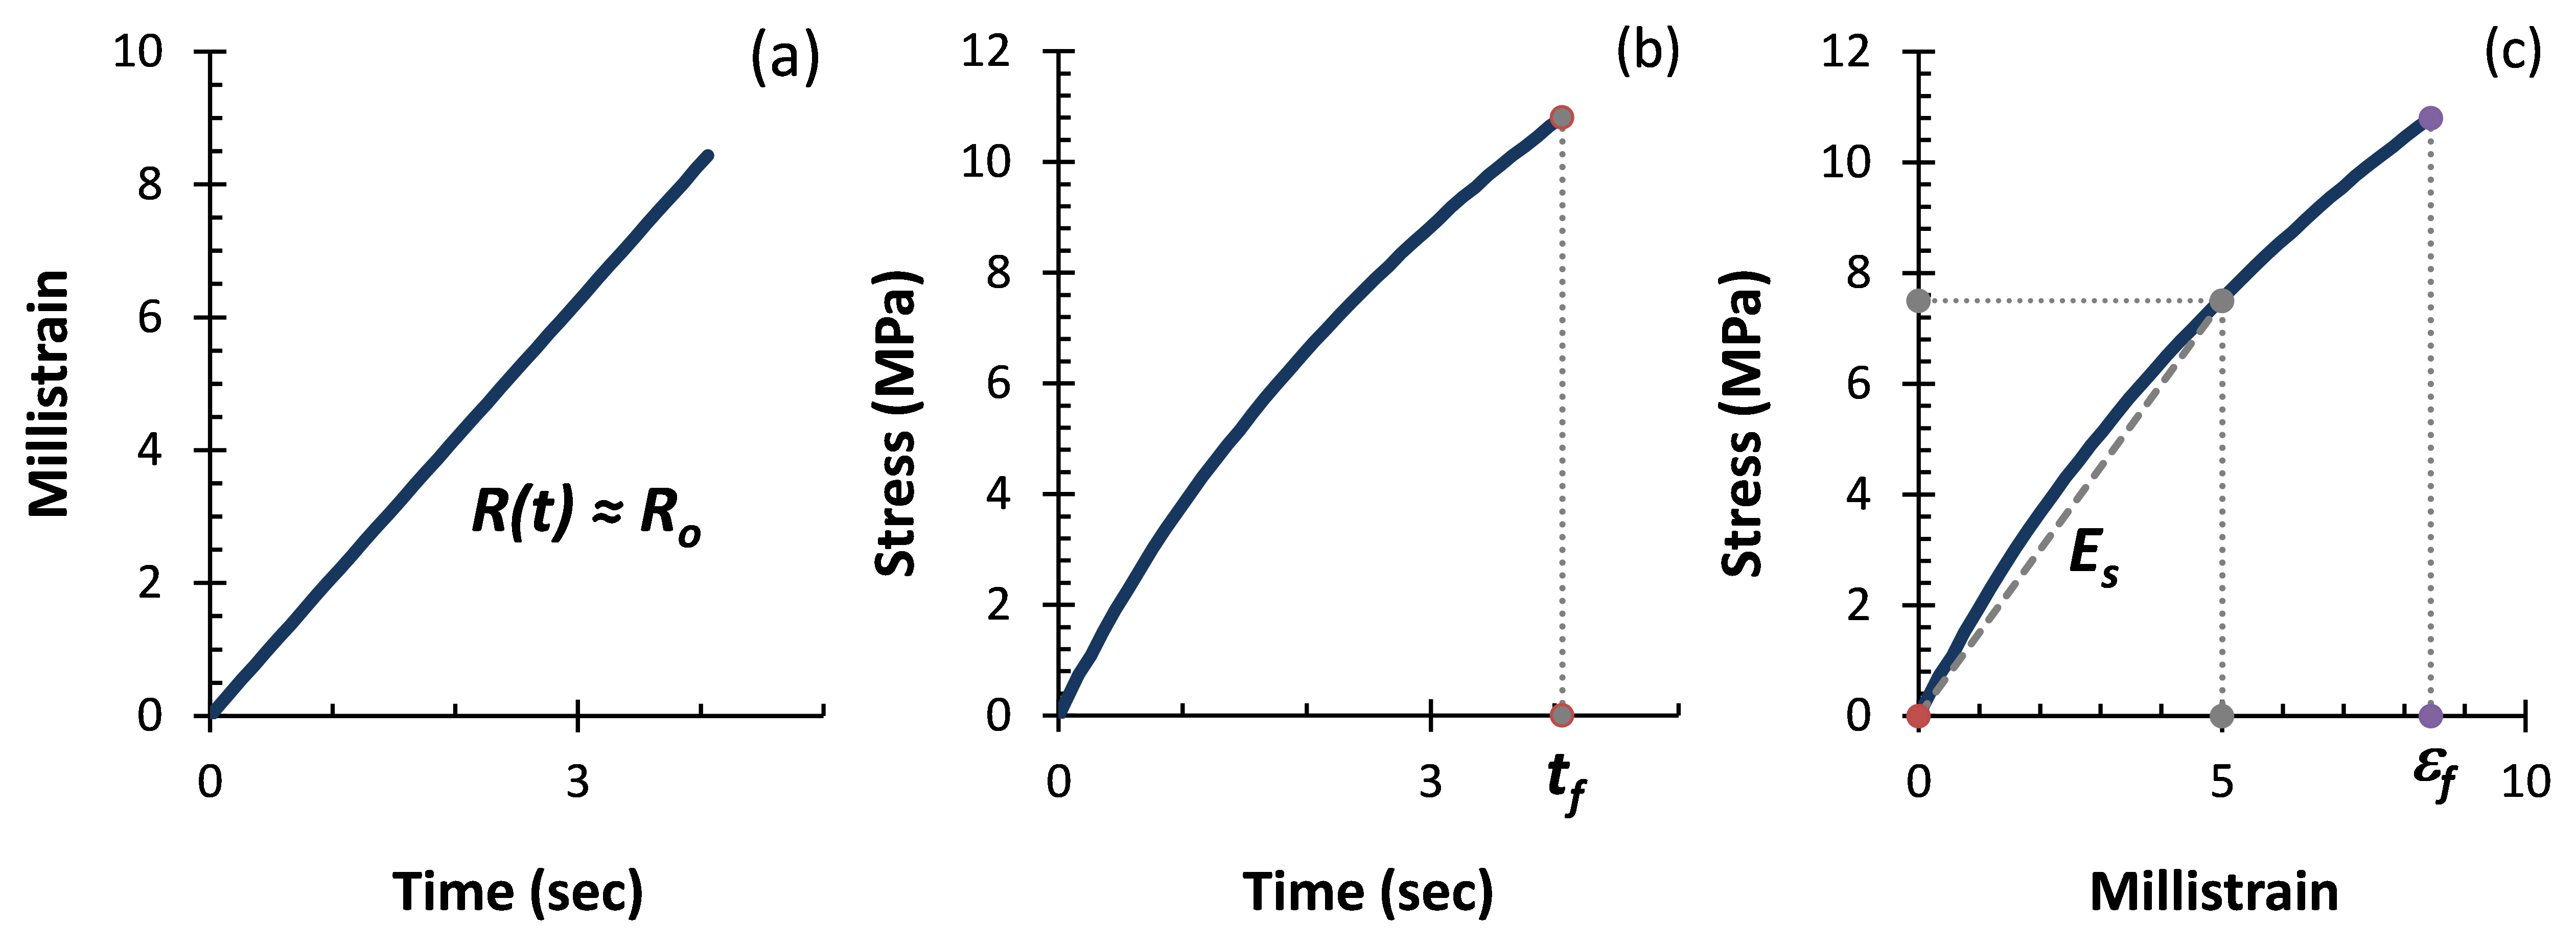
Figure 2.2 illustrates the results of a tensile test with the time dimension added. The first graph (fig. 2.2a) shows the strain history as millistrain versus time, and indicates that the strain rate, R, is constant during the constant speed test due to the low failure strain. At higher strains, the strain rate would measurably decrease during a constant speed test due to the changing length of the sample. The second graph (fig. 2.2b) gives stress versus time, and the third (fig. 2.2c) presents a stress-strain curve. The latter shows a secant modulus, Es (at strain ε = 0.005), and the strain at failure εf. Secant modulus can be a useful measure of stiffness due to nonlinearity caused by relaxation during the tensile test.
Stress Relaxation
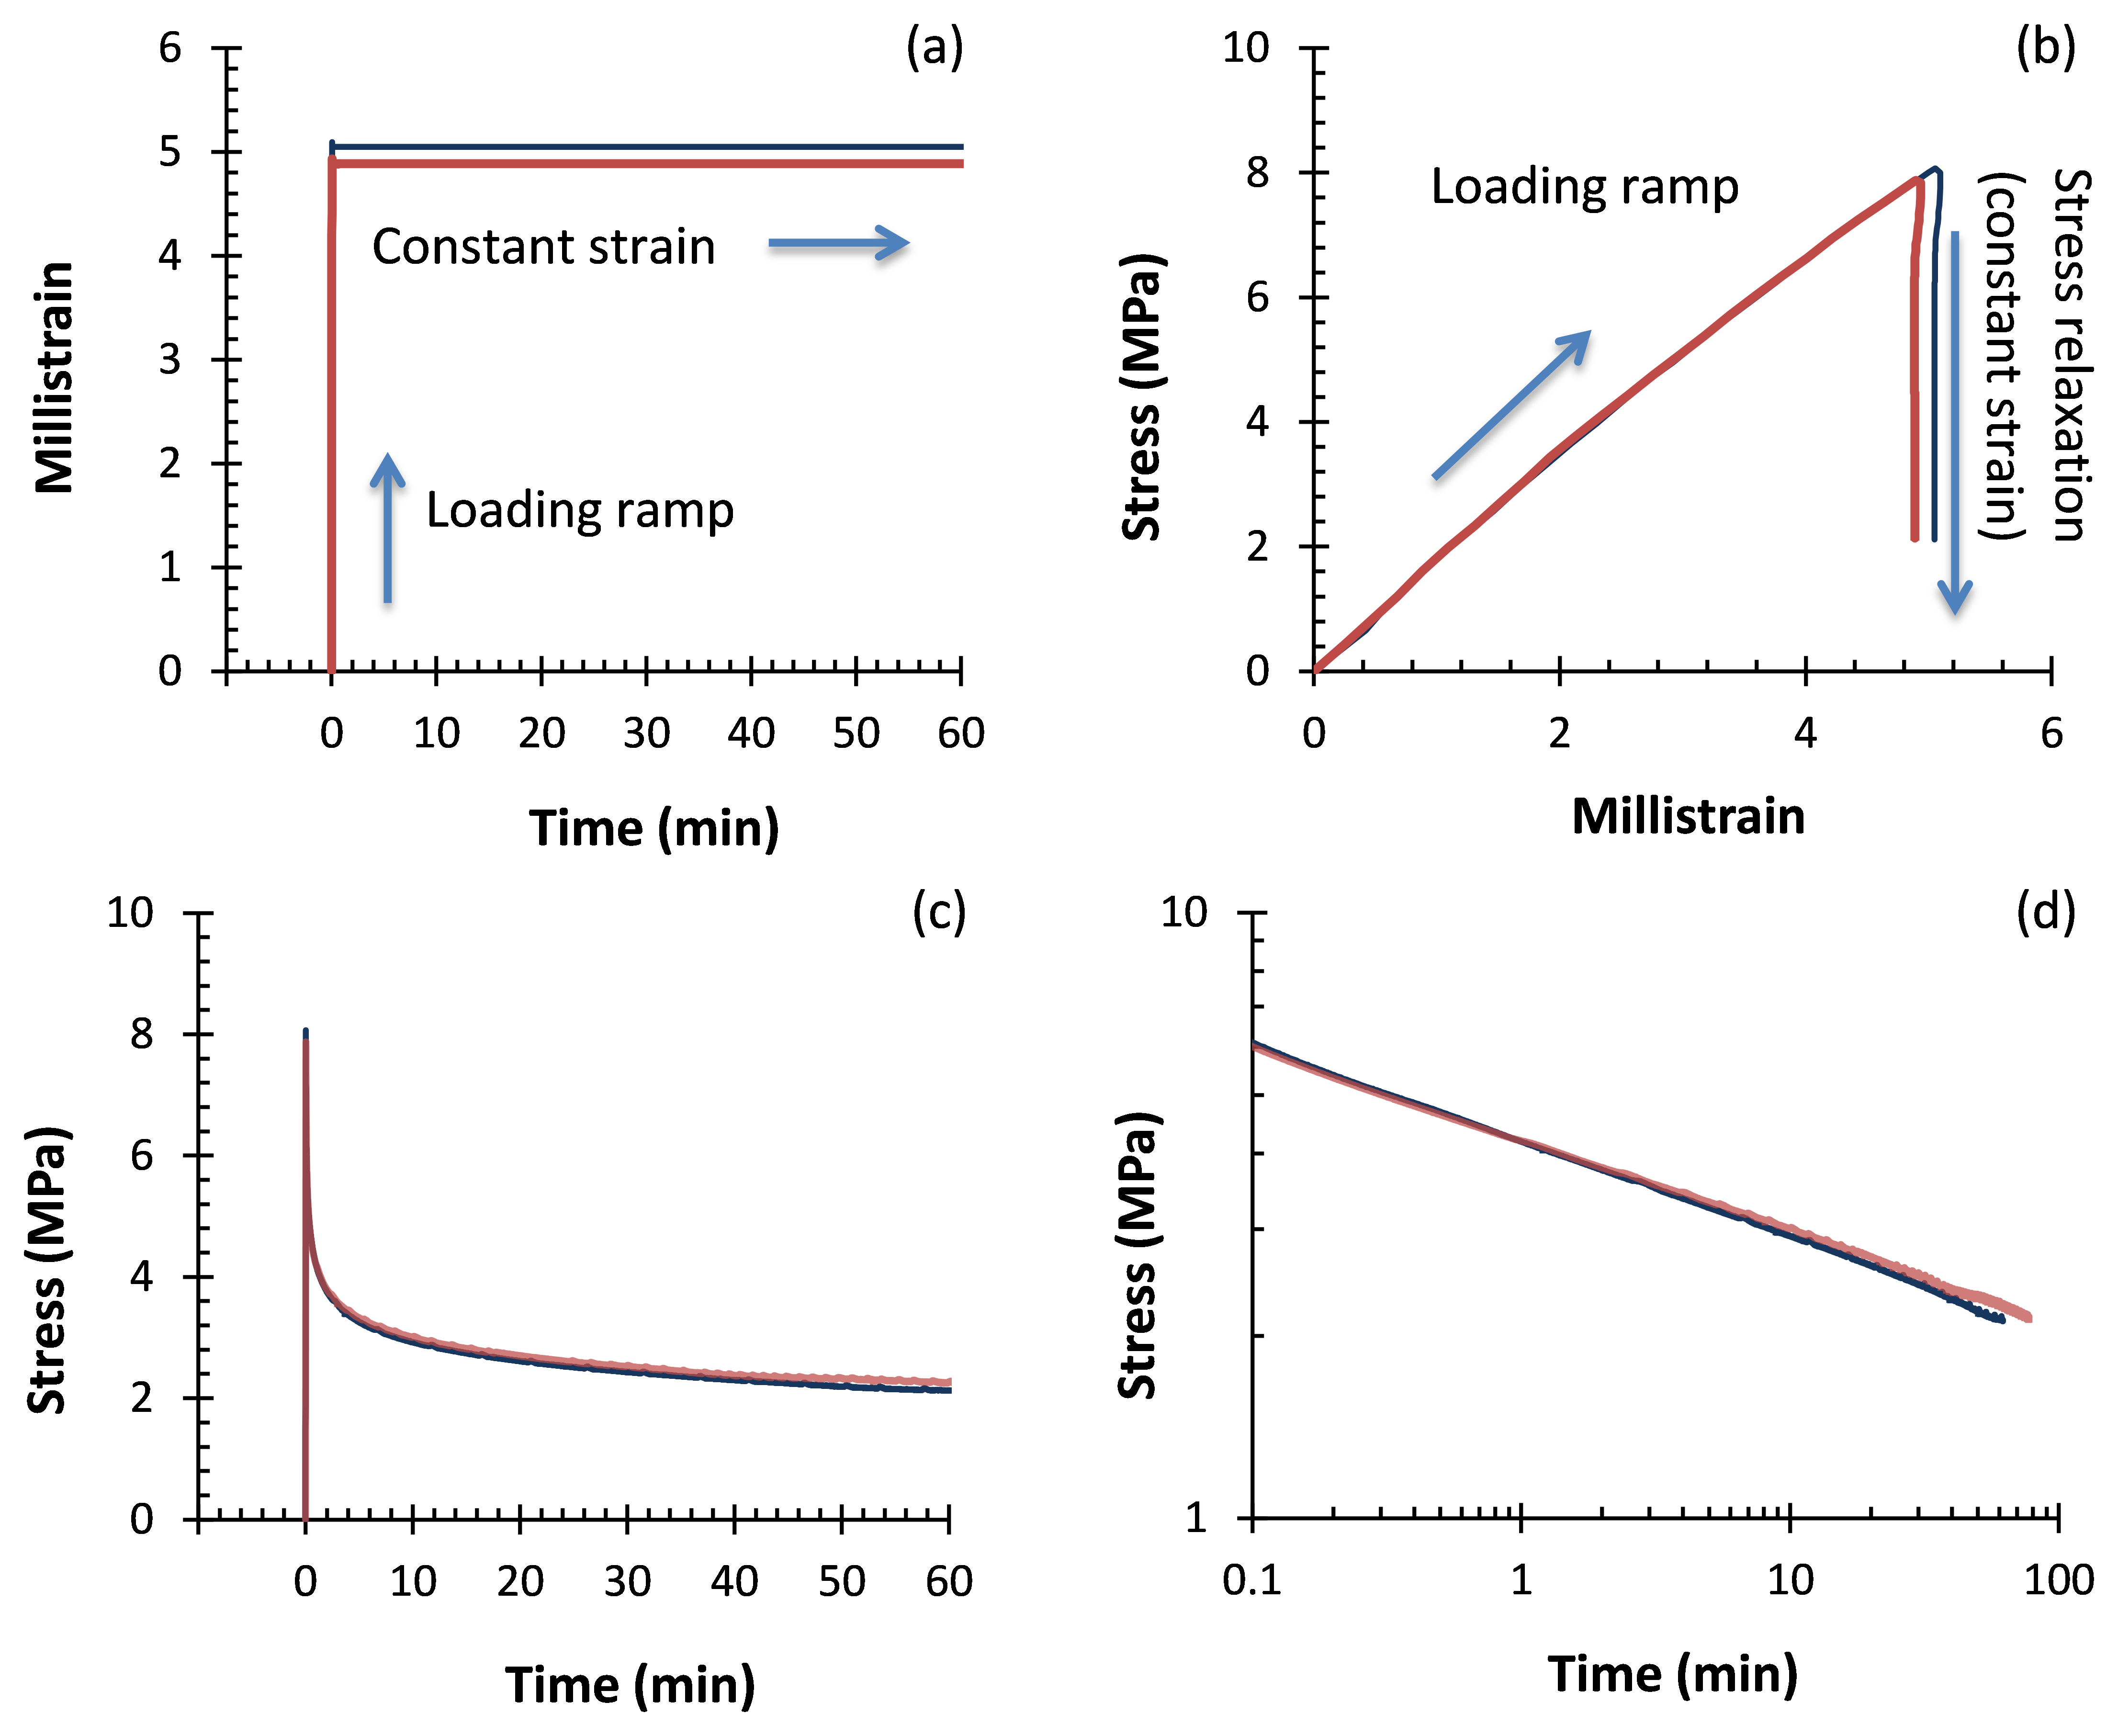
A relaxation test is another useful experiment for studying time-dependent material properties, and it is particularly relevant to canvas-supported paintings. Figure 2.3 illustrates the different parameters in a stress-relaxation test performed on a Winsor and Newton Foundation White film. The first graph (fig. 2.3a) shows the strain history as an initial loading ramp, followed by constant strain during measurement of stress relaxation. The second (fig. 2.3b) shows the loading ramp on a stress-strain curve, and a vertical drop in stress during the constant strain segment. Figure 2.3c gives the stress relaxation process on a plot of stress versus time, where it appears that stress is approaching equilibration after a sharp initial drop. The final plot (fig. 2.3d) shows the same data on a log-log scale and highlights that the sample is still relaxing. The results also show similar findings for a repeat test that was performed on the same sample after a twenty-four-hour recovery period. During cyclic load testing on viscoelastic materials, it is important to consider strain history and its effects on repeated measurements.
The stress-relaxation test method outlined in figure 2.4 is the approach used in the CCI Lining Project to investigate the effects of different lining treatments for paintings on canvas (Michalski, Stefan, and Debra Daly Hartin. 1996. “CCI Lining Project: Preliminary Testing of Lined Model Paintings.” In ICOM Committee for Conservation: 11th Triennial Meeting, Edinburgh, Scotland, 1–6 September, 1996: Preprints, edited by Janet Bridgland, 288–96. London: James & James; ICOM Committee for Conservation.). From recent work, figure 2.4 shows a plot of tension (kN/m) versus time after a fixed strain was applied to each sample (Daly Hartin, Debra, Eric Hagan, Stefan Michalski, and Mylène Choquette. 2011. “CCI Lining Project: Testing of Lined Model Paintings from Fractions of a Second to Decades.” In ICOM-CC Lisbon 2011: Preprints, 16th Triennial Conference, Lisbon, 19–23 September 2011, edited by Janet Bridgland and Catherine Antomarchi, paper 1309, 288–96. Almada, Portugal: Critério Produção Grafica; Paris: ICOM Committee for Conservation.). The initial sharp spike is caused by the rapid initial strain (see figs. 2.3b, 2.3c), which is followed by a quick decay in tension due to stress relaxation. The model painting with a linen lining shows no difference from the model painting (unlined) over the measurement time scale. The sailcloth lining causes a uniform vertical shift in tension due to the stiffness of the fabric, which is constant over the sixty-hour period. An advantage of the sailcloth lining is that its stiffness allows for a stable increase in tension, with less strain imposed on the painting. In fact, the strain could be reduced to roughly half and still maintain a similar tension to the model painting in the experimental time scale. The wax-resin lining also shows a strong vertical shift due to the wax stiffness; however, it also exhibits relaxation characteristics.
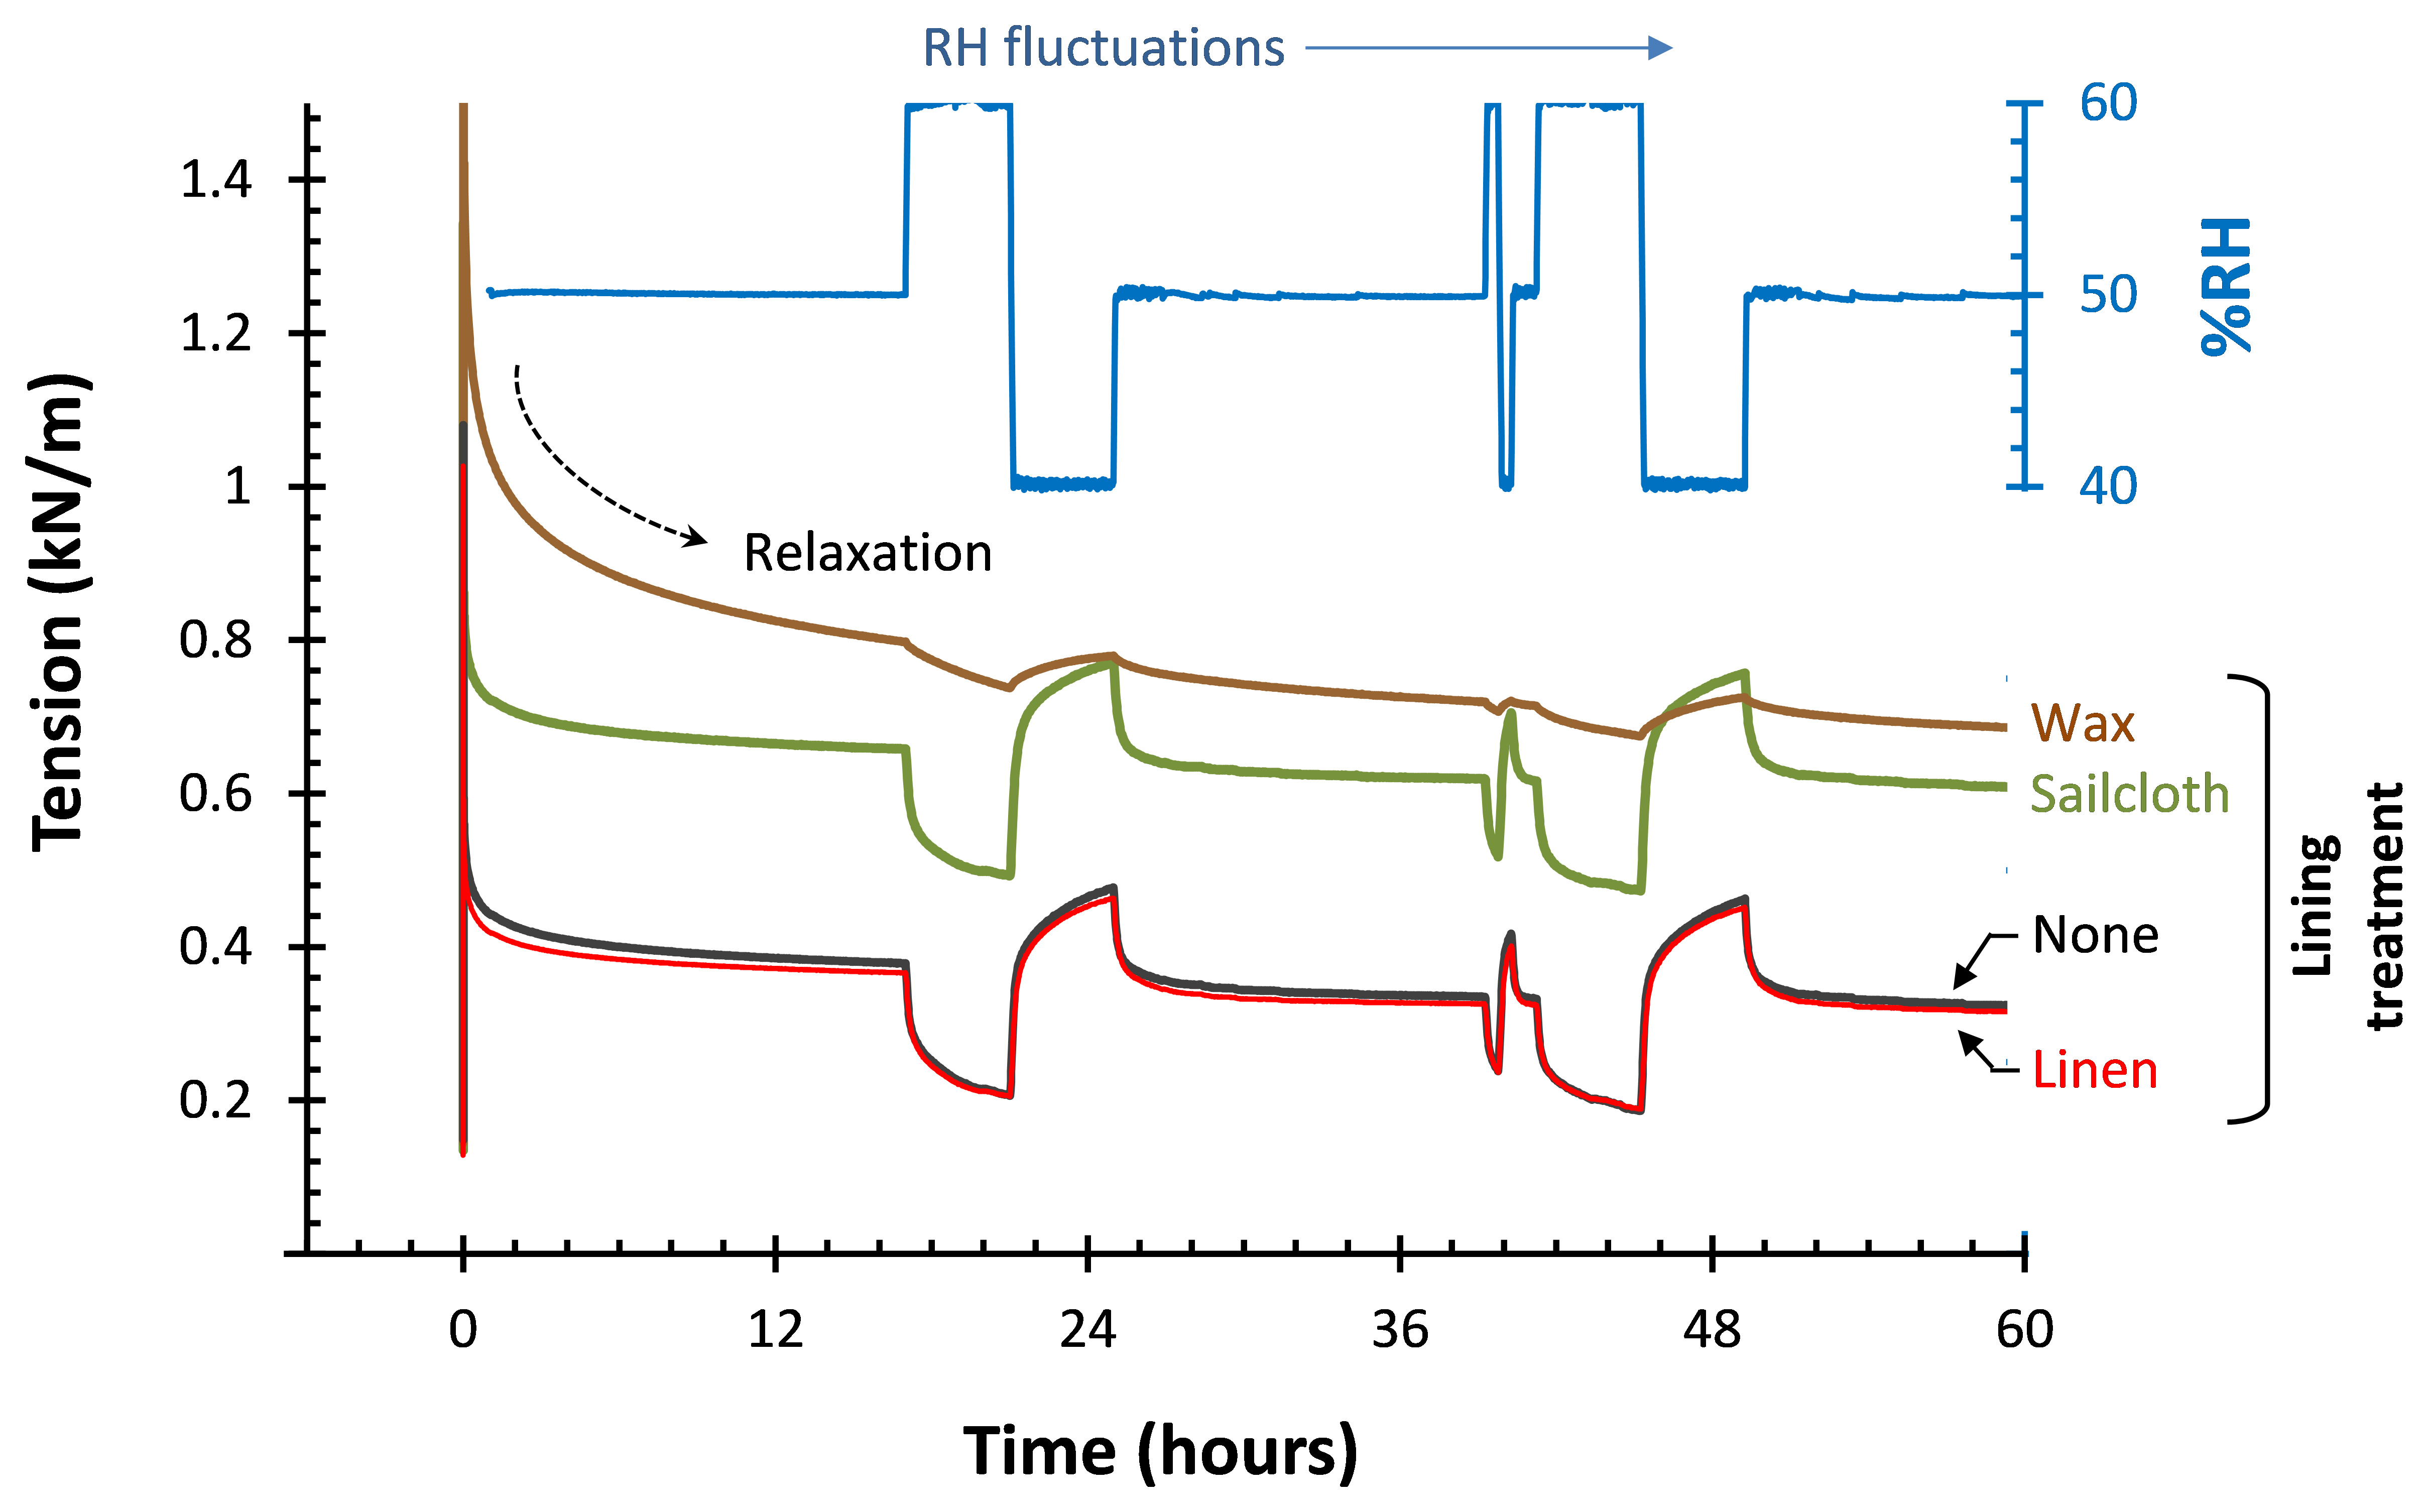
The addition of RH fluctuations in figure 2.4 highlights some further trends in the lined painting response. Sailcloth and linen have no effect on the response of the painting, since the linings do not constrain the paint layers in the direction of applied tension—that is, painting and lining are free to shift across one another. In contrast, the wax-lining impregnates the canvas and constrains the paint layers from shrinking or swelling due to contact with the supporting layers of the painting. The paint layers still respond to RH fluctuations; however, the wax adds surface constraint that prevents movement and a subsequent change in tension measured at the ends of the sample. A more in-depth discussion of the CCI Lining Project is provided by Daly Hartin and colleagues (Daly Hartin, Debra, Eric Hagan, Stefan Michalski, and Mylène Choquette. 2011. “CCI Lining Project: Testing of Lined Model Paintings from Fractions of a Second to Decades.” In ICOM-CC Lisbon 2011: Preprints, 16th Triennial Conference, Lisbon, 19–23 September 2011, edited by Janet Bridgland and Catherine Antomarchi, paper 1309, 288–96. Almada, Portugal: Critério Produção Grafica; Paris: ICOM Committee for Conservation.); therefore, the following discussion provides more general information regarding the viscoelastic behavior of painting materials.
Time-Temperature Superposition
Over a wide range of test conditions, it is impractical to summarize tensile data from a viscoelastic material with stress-strain curves. It is also not feasible to measure the full relaxation behavior from glassy to rubbery—a process occurring over many decades—at one temperature, due to equipment limitations and time constraints. In figure 2.1, it is clear that a relationship exists between strain rate and temperature, since increasing the rate by an order of magnitude is equivalent to decreasing temperature by 10°C. This implies that time-temperature superposition (TTS) is a potential tool for efficiently summarizing data (Williams, Malcolm L., Robert F. Landel, and John D. Ferry. 1955. “The Temperature Dependence of Relaxation Mechanisms in Amorphous Polymers and Other Glass-Forming Liquids.” Journal of the American Chemical Society 77, no. 14: 3701–7. https://doi.org/10.1021/ja01619a008.). To illustrate this method, figure 2.5a shows a simplified summary of modulus values at three temperatures and four strain rates within a practical test window. This test window is bounded by equipment limitations and practical time available for data collection. Figure 2.5b shows the result of fixing data at a chosen reference temperature, Tref = 20°C, and figure 2.5c shows horizontally shifting data at the other temperatures to line up as a single master curve. The result shows a shift from glassy to rubbery behavior over a broader scale than the experiments allowed in direct measurement. Tabulated results of the horizontal shift factor versus temperature allow one to create a master curve at any Tref of interest within data limits. Defining Tref at the glass transition temperature, Tg, would also allow comparison with theoretical functions, and possible extrapolation to temperatures beyond the test conditions. There are many reasons why the simple TTS method may not work for certain materials; however, it is a powerful tool when it does.
It is helpful to consider practical situations where the viscoelastic properties are of importance. As a simple example, figure 2.6a shows a schematic of a broken and curled flake of paint that is deformed back into the plane of the painting. The radius of curvature (r) and film thickness (h) is labeled simply to highlight that it is possible to estimate the strain rate from a few parameters and define the time scale of the applied deformation. Rolling or unrolling a canvas painting is another similar and geometrically simple example. In figure 2.6b, the stiffness reduction caused by decreasing the rate of deformation is shown as the path from point A to point B along the master curve. In contrast, path A→C indicates the effect of keeping the same strain rate but using higher temperature to shift the master curve horizontally. The higher temperature accelerates the polymer relaxation and leads to a lower stiffness at a given strain rate. The horizontal shift may also be caused by a plasticizing effect, such as an increase in moisture content (Maksimov, R. D., V. P. Mochalov, and Yu S. Urzhumtsev. 1972. “Time—Moisture Superposition.” Polymer Mechanics 8, no. 5: 685–89.). Path A→D shows a final example from the combined effect of decreasing the rate of deformation while also increasing temperature. Care should, of course, be taken when increasing temperature and moisture content, since extremes may cause unwanted effects beyond the simple relaxation process described here.
The concepts discussed in this section are often studied using a technique called dynamic mechanical analysis (DMA) (Nielsen, L. E., and R. F. Landel. 1994. Mechanical Properties of Polymers and Composites. 2nd ed. New York: Marcel Dekker.). This can rapidly give modulus data as a function of temperature and frequency using a single sample and show transition regions. Experiments involving tensile tests are typically used when the large-strain response, or failure properties, are of interest.
Ultimate Properties
The purpose of using tensile test data in studies of artists paints is due to the interest in characterizing their large-strain response, particularly the failure criteria as a function of time and temperature. The related research work of Thor Smith in the 1960s is of interest since it shows the application of TTS to the ultimate properties of plastics and elastomers. Smith clearly summarizes an important finding in one of his many papers on this topic:
The ultimate tensile properties (the stress at break σb, and the corresponding extension ratio λb) vary markedly with the temperature and with the stress-time or strain-time history prior to rupture. Considerable evidence indicates that data obtained at different temperatures can often be superposed to give master curves which show the variation of σb and λb over many decades of time at a fixed temperature. Further, the temperature shift factor is the same—or nearly the same—as that used to superpose viscoelastic data representing small-deformation behavior. In other words, the same molecular parameters which influence chain mobility, thus the time and temperature dependence of linear viscoelastic response, also have a controlling effect on the time and temperature dependence of the ultimate tensile properties. (Smith, Thor L. 1965. “Deformation and Failure of Plastics and Elastomers,” Polymer Engineering and Science 5, no. 4: 270–79.)
Recent studies on artists paints have highlighted the application of this approach for generating master curves of failure strains from tensile data. Figure 2.7a shows a generalized illustration of a failure envelope created using a similar approach to that shown for modulus data (see fig. 2.5). The path to point A results in failure before reaching the target strain at the defined strain rate. Reducing the strain rate avoids failure for the path to point B, which is outside of the failure envelope. Figure 2.7b shows the path to point C outside of the failure envelope due to a horizontal shift of the master curve from a temperature increase or possibly a plasticizing effect (e.g., increased moisture content). Combining higher temperature and reduced strain rate locates point D even farther from the failure line.
This concept of a failure strain master curve is also shown in figure 2.8 using tensile data from two artists paint films at Tref = 20°C (Hagan, Eric W. S. 2017. “Thermo-Mechanical Properties of White Oil and Acrylic Artist Paints,” Progress in Organic Coatings 104 (March): 28–33. https://doi.org/10.1016/j.porgcoat.2016.10.019.). The acrylic paint film (fig. 2.8a) shows a considerably larger combination of strains and strain rates that avoid failure compared to the oil paint (fig. 2.8b). This illustrates why cracking of acrylic latex paints is much less common than in traditional oils over a wide range of conditions.
Conclusions
An overview of the viscoelastic properties of artists painting materials was provided to highlight important trends in their mechanical behavior. Example tensile test and stress relaxation data were presented for paint films and lined painting samples, respectively. These data showed a time and temperature dependence on measured stiffness and failure strains. For lined painting samples, stress-relaxation data indicated clear differences in the response of different treatment methods. The sailcloth lining showed value in maintaining consistent tension over time, potentially reducing the amount of strain on the painting for a given tension.
The concepts were further developed through a discussion of the time-temperature superposition principle and the creation of master curves of stiffness and failure strains. This technique can effectively summarize properties over a broad time scale and may be referenced at a temperature of interest. The master curves were used to illustrate how stiffness and failure strains are manipulated by changing the rate of deformation, temperature, or moisture content. In practice, it is not possible to know the shape of these curves for the wide variety of materials found in paintings; however, an understanding of the trends in material behavior is important when applying heuristics to treatment methods.