This chapter aims to guide both nonspecialists and specialists in understanding and/or using techniques for analyzing the metals from which sculptures are made. Metal analysis encompasses elemental analysis, isotope analysis, and metallography (the study of metal microstructure). The analysis of surface layers (, , et cetera) is addressed in II.6.
The basic information here will help nonspecialists navigate the wide range of analytical techniques now available and determine which are best suited to answer which questions (for a summary, see also tables 5, 10 Open viewer). A comprehensive list of existing techniques and their advantages and drawbacks may be of interest for specialists as well. Several related topics are discussed in I.2, including a fundamental description of what metal is; what types of copper alloys have been used for sculpture; what is meant by “major,” “minor,” and “trace” elements; and what is meant by “microstructure.”
1 Elemental analysis: overview
1.1 Principles
Elemental analysis determines the proportion of different chemical elements present in a particular sculpture’s casting alloy. The elemental analysis may be qualitative or quantitative. The former simply lists the elements detected, with only a rough idea of their relative amounts; the latter gives a measurement of the amount of each element present as a percentage of the total, usually reported as a weight percent (wt%). Quantitative analysis should also provide an estimate of the uncertainty associated with the measurement (the error).1
Some researchers also use the term “semi-quantitative,” often in circumstances where the error of the measurement is relatively large, or unknown. In such circumstances, the numerical measurements are unlikely to be reproducible by other analysts and are thus not useful for comparison with the results of other laboratories.
1.2 Accuracy, precision, and sensitivity
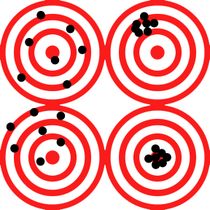
Any quantitative analytical method can be characterized in terms of accuracy, precision, and sensitivity. In scientific terms, an accurate method is one where the average of many measurements is likely to be very close to the true value. This is sometimes called trueness. An analytical method is considered precise if the results of many repeated measurements are likely to be very nearly the same. Given these definitions, an analytical method can be accurate, precise, neither, or both. A common way of visualizing these four possibilities is shown in figure 413. The term “sensitivity” can be used in different ways in reference to chemical analysis, and there have been vigorous debates on the subject. Here, the term is used in its common sense, as “a device’s ability to detect a small amount or slight change in the measured quantity.”2
1.3 Application to bronze sculpture
A basic alloy-type determination should be standard practice for the technical study of bronze sculpture for purposes of documentation and typology. This may be achieved with qualitative analysis. Quantitative analysis provides additional important information that may help to refine the possible date of production or confirm that a sculpture’s alloy is consistent with securely identified examples from a certain time period, region, workshop, or even artist (see I.2§4.1).
In the end, the information that may be derived from elemental analysis of any given sculpture depends to a large degree on the quantity and quality of reference data available from comparable, well-documented examples. Conducting new and rigorous analysis of securely attributed works is of great importance to expand the body of knowledge usable for comparative purposes. Some strides have been made in the development of large, shared databases of copper alloy compositional data,3 which facilitate sophisticated statistical analysis that will certainly lead to new discoveries with regard to workshop, regional, and temporal characterization of bronze sculpture.
Different methods of elemental analysis may be invasive, noninvasive, or minimally invasive. The terms “destructive” and “nondestructive” are also commonly used, although in analytical sciences, “destructive” refers specifically to the sample, not to the item: the analysis is destructive if the sample is destroyed after analysis, nondestructive if not. Each type of analysis has its advantages and disadvantages.
2 Non- or micro-invasive methods of elemental analysis
2.1 X-ray fluorescence analysis (XRF)
X-ray fluorescence analysis (XRF) is a relatively accessible analytical method employed to characterize elemental composition. It is nondestructive and offers rapid, multi-element analysis with good sensitivity, often down to a few hundredths of a percent in copper alloy samples (equivalent to a few hundreds of parts per million [ppm]). A beam of X-rays is directed at the sample material to stimulate the emission of fluorescent X-rays with specific energies characteristic of the elements present.
The emitted X-rays are detected and converted into a spectrum, either with an energy dispersive (ED-XRF) or a wavelength dispersive (WD-XRF) detector. ED-XRF is far more common than WD-XRF and is used in all of the portable and handheld XRF instruments that are now widely available in museum and university laboratories. ED-XRF offers the possibility of giving a quick qualitative assessment of the type of alloy present. Newer silicon drift detectors (SDDs) take measurements in a minute or less, making it possible to take many measurements in the course of an examination.
To optimize results for historic copper alloys, voltage on the spectrometer should be set relatively high (around 40–50 kV). In most cases, moderate to heavy filtration of the beam is advantageous, using aluminum, titanium, and/or copper filters. In the case of modern sculptures, if light elements such as silicon, phosphorous, or aluminum are to be analyzed, filters should be removed, the voltage turned down to about 15kV, and a helium flush or vacuum should be used if available. These operating parameters also allow for the analysis of sulfur in both historic and modern bronzes, which may be very informative.
Due to the complex interactions between X-rays and the sample material, quantitative alloy analysis with ED-XRF requires complex calibration procedures. Many ED-XRF instrument manufacturers provide software and calibrations for metals that will generate quantitative results. Unfortunately, the use of manufacturers’ proprietary calibrations comes with some difficulties: the results from different manufacturers (and even different models from the same manufacturer) are often not in agreement; it can be difficult or impossible for the user to select the list of elements to be quantified; error estimates are often unrealistically small; and the spectrum processing and calibration methods used are often not transparent to the user.4 These and other factors make it difficult to share quantitative results confidently between researchers, and manufacturers’ results should generally be considered semi-quantitative. Some protocols designed to enhance reproducibility and facilitate sharing have been developed that may be useful to researchers wishing to share results and build collaborative databases.5
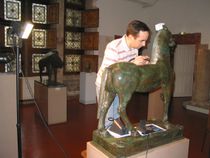
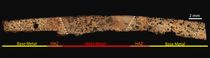
Elemental mapping may be done using XRF. Dedicated XRF scanners are available that are capable of scanning flat (or nearly flat) areas of a square meter or more at high resolution. For three-dimensional objects, smaller areas are scanned (typically a few square centimeters) with many individual analyses of the elemental composition at definite points, together defining an elemental map (fig. 414).6 The objective may be to detect and characterize and ; , , or ; and/or repairs. Mapping requires specialized equipment and software.
XRF is essentially a surface analysis technique, with an effective penetration in copper alloys of around 30–80 µm, or less than a tenth of a millimeter. This means that the technique is very sensitive to surface alteration or contamination. For qualitative use on historic materials, this is usually not a significant problem. But for quantitative analysis, surfaces to be measured should be clean, flat, and free from patina or .7 It is possible to encounter both surface enhancement and surface depletion of selected elements that may result in misleading results, particularly with archaeological materials. Working with an XRF analyst who has significant experience with copper alloys can help produce reliable and useful results for comparative purposes.
In 2023, portable ED-XRF instruments cost between US$25,000 and $50,000. Commercial laboratories may be able to provide analysis for US$50 or less per sample.
WD-XRF offers significantly higher spectral resolution and sensitivity than ED-XRF, but is less common and much more expensive to own and operate. Samples for WD-XRF analysis are typically extracted from the sculpture, embedded, cut, and polished prior to analysis. Sample size requirements may vary, but are often from 1 × 1 mm to 5 × 5 mm. These instruments are found primarily in commercial and research laboratories focusing on earth sciences. In theory, WD-XRF instruments offer the possibility of more precise quantitative analysis of alloy composition than ED-XRF instruments, although many earth sciences labs may not routinely analyze copper alloys, and therefore may not have calibrations prepared in advance. Costs per sample are normally less than US$100.
2.2 Particle-induced X-ray emission (PIXE)
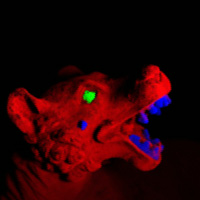
Particle-induced X-ray emission (PIXE) commonly utilizes a highly collimated beam of protons to excite X-ray emission from a sample. Other charged particles may be used as well, but protons are by far the most common. It is possible but not necessary to place the sample in a vacuum chamber or flush it with helium to improve detection of light elements. X-ray spectra are collected, usually by an ED detector, for processing into a quantitative elemental composition. PIXE offers better sensitivity than XRF8 and can detect very small quantities of many materials typically present in casting alloys, often as little as a few tenths of ppm. Moreover, PIXE offers better spatial resolution (a few tenths of microns) thus enabling the analysis of very small features such as inlays (fig. 350). In the case of point analysis, no specific preparation is required, though as with XRF, PIXE analysis is a surface technique, so the sample site should be clean, flat, and free of patina or corrosion. The depth of penetration of PIXE using protons is somewhat less than for XRF. Unfortunately, few facilities provide access to ion beam analysis techniques.
As for XRF, chemical mapping can be carried out with PIXE.9

2.3 Other techniques
2.3.1 Laser-induced breakdown spectroscopy (LIBS)
Laser-induced breakdown spectroscopy (LIBS) uses a focused, high-intensity, pulsed laser to vaporize tiny spots of sample material. The plume of plasma generated at the sample site is immediately analyzed by optical (or atomic) emission spectroscopy (see II.5§3.1 below). Usually, many laser “shots” are recommended, and the results are averaged. LIBS instruments are fast and easy to use, but for quantitative analysis they face significant hurdles in producing consistent and reproducible results.10 Handheld LIBS instruments are becoming more widely available, and at lower prices.
2.3.2 Eddy current testing (ECT)
Eddy current testing (ECT) is an analytical technique that uses a coiled wire probe to produce an alternating magnetic field, which then induces an alternating current in a conductive sample material (usually metal). The alternating current flow in the sample generates, in turn, a magnetic field that interacts back with the magnetic field and current flow in the probe. Monitoring electrical impedance in the coil probe yields information about the nature and structure of the sample material.
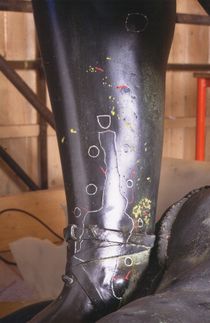
ECT can distinguish between different major alloy types in solid metal, but its main use is in detecting flaws, repairs, and inlays. For this purpose, ECT relies on the fact that current is interrupted by discontinuities in the metal—that is, where a cast-in repair, , or inlay has been added, or at the site of a . By mapping sites of discontinuity, it is possible to draw a quite reliable contour of the feature on the surface of the sculpture. A probe with a sharp point can help to improve precision. The technique may allow a qualitative appraisal of the nature of repairs, and help to form groups with similar behavior for subsequent in-depth investigation using other techniques.11 ECT is often used when radiography is not an option (fig. 415).
2.3.3 Neutron diffraction
Neutron diffraction is a rarely used technique that can characterize the composition of the bulk metal in a bronze sculpture.12 This may be accomplished in conjunction with neutron tomography (the principles of neutron radiography and tomography are described in II.3§3). Only certain elements can be detected and quantified using neutron diffraction, and the error of measurement is relatively high compared to other techniques, but analysis with neutrons has the advantage that it can measure the composition of the metal throughout the thickness of the metal wall, and it is possible to map the composition at different points onto a tomographic reconstruction that reveals spatial variations.
Neutron diffraction has also been shown to be able to discriminate between bronze surfaces that have been and .13 This is done by detecting residual stresses (elastic strain) in the surface metal that are not present 1–2 mm below the surface.
Neutron diffraction is a highly specialized technique requiring large-scale research facilities, typically nuclear reactors. In such cases there is often no fee per se for the imaging, but there will be a lengthy application process to secure the allocation of a facility’s time and instrumentation. Costs can, of course, be significant for transportation and security, and the administrative burden can be substantial.
Another serious consideration is that atoms that absorb neutrons into their nuclei during imaging form radioactive isotopes that subsequently emit gamma radiation. These isotopes must be allowed to decay to safe levels before handling. Depending on the specific elements present and the length and intensity of exposure (tomography requires significantly longer exposure than radiography), this period of quarantine may be several hours, days, or even longer, imposing additional cost and security considerations. The presence of gold, for instance, can dramatically increase the quarantine period.
3 Invasive techniques of elemental analysis
3.1 Atomic spectroscopy techniques: atomic (or optical)
emission spectroscopy (AES or OES) and atomic absorption
spectroscopy (AAS)
Atomic spectroscopy refers to a group of analytical techniques where sample material is introduced into a flame, furnace, electric arc, or plasma and breaks down into individual atoms and ions. In this excited state, the atoms emit and absorb specific frequencies of light (from near-infrared to ultraviolet, including the visible light range) that are characteristic of the specific elements present. The elemental composition of the sample is thus determined by analyzing the spectral features of the emitted light (atomic or optical emission spectroscopy, or AES/OES) or of light transmitted through the excited sample material (atomic absorption spectroscopy, or AAS).
Atomic spectroscopy was at the very origin of the rise of archaeometallurgy as a discipline.14 In particular, flame AAS and inductively coupled plasma AES (ICP-AES) have provided the large majority of published analysis on bronze sculpture so far.15 ICP refers to a highly controlled and reproducible method for the atomization/ionization of sample material using plasma made from an argon stream.
AAS and AES are sensitive to trace quantities of elemental components, from several hundreds of ppm to the ppm level in a copper matrix depending on the element. This allows precise quantification of a large number of trace elements, which may be useful, notably when addressing provenance questions. Preparation of the sample for analysis involves complex chemical digestion procedures to dissolve all components of the sample. The complexity of atomic spectroscopy techniques means that analysis is best performed by private or university laboratories specializing in this analysis, and with staff experienced in cultural heritage applications. Small changes to the analysis protocol can make significant differences in the quality of the outcome.
Analysis by atomic spectroscopy techniques typically requires a sample of about 10–50 mg. At the time of this publication, costs per sample range from around US$100 to $350 for academic clients.
3.2 Mass spectrometric techniques: inductively coupled
plasma mass spectrometry (ICP-MS) and laser ablation
ICP-MS (LA-ICP-MS)
In recent years, ICP mass spectrometry (ICP-MS) has largely superseded ICP-OES as the method of choice for the analysis of trace elements in bronze alloys. As with ICP-AES, the sample is atomized and ionized using an inductively coupled plasma. But instead of characterizing the light emitted during excitation, ICP-MS relies on direct detection of the ions produced in the plasma stream. These are sorted and counted by the spectrometer according to their mass-to-charge ratios. ICP-MS are complex instruments and are made in several different configurations, but all measure the abundance of each ion type with a high degree of sensitivity, leading to limits of detection typically 10–1000 times lower than ICP-AES (ppm to ppb), depending on the element and the instrument configuration.16 ICP-MS can also detect different isotopes of the same element, allowing for isotopic analyses (see below).
ICP-MS systems are significantly more expensive to purchase and operate than ICP-OES systems. As for atomic spectroscopy techniques, ICP-MS analysis is best conducted in specialized laboratories dedicated to the technique and with staff experienced in the analysis of cultural heritage materials.
ICP-MS has had a disadvantage in comparison to ICP-AES, which is a difficulty in analyzing, with one single sample, a wide range of element concentrations (from sub-ppm to percent levels). When optimized for trace elements, major elements (tin, lead, and zinc) have often been measured with relative precision equal to or lower than by ED-XRF, and copper has rarely been quantified at all. Significant improvements in instrument design since the 2010s have largely mitigated this problem.
ICP-MS is sometimes used in conjunction with laser ablation (LA), a technique that uses a focused, high-intensity, pulsed laser to vaporize tiny spots of sample material that are then drawn into the ICP-MS instrument. LA-ICP-MS is generally considered a micro-destructive technique because the ablation spots are extremely small, but it is generally applied to fragments or samples that are small enough to be placed onto an instrument’s analysis stage, often only several inches across. Laser spot sizes often fall in the range of 10–300 µm, so multiple sites should be analyzed within the sampling area to ensure that micro-inhomogeneities in the metal structure do not yield misleading results.
Various so-called matrix effects can complicate quantitative analyses produced via LA-ICP-MS. While the technique has been used extensively for the quantitative analysis of glass, it has only been applied relatively recently to quantitative analysis of copper alloys and is not yet widely considered an established technique. As with LIBS, its ability to repetitively ablate the material may give access to sound metal below the intentional patina and/or corrosion layers.
3.3 Neutron activation analysis (NAA)
Neutron activation analysis (NAA) is based on the principle that if a sample material is bombarded with relatively low-energy “thermal” neutrons (usually produced at a nuclear reactor), the atoms in the sample will capture neutrons into their nuclei, forming radioactive isotopes. As these isotopes decay over a period of days or weeks, they emit gamma rays characteristic of each element present in the sample. The gamma rays may be detected and identified, leading to a quantitative estimate of the sample’s total elemental composition. The high penetrating power of neutrons and gamma rays means that NAA provides information from the interior as well as the exterior of the sample material. Neutron activation is a highly sensitive method for chemical analysis. Data for a wide range of elements can be obtained with sensitivity at the low- and even sub-ppm level. No specific preparation of the sample is needed.
NAA may be used as a noninvasive technique if the entire object to be studied is analyzed, though often samples are taken in order to reduce cost and transportation issues for valuable sculptures. A drilled sample also allows for removal of surface layers and corrosion product prior to analysis. Reliable results require about 50–100 mg of sample material. Sensitivity for some elements is less than for ICP-MS, and the analysis requires more time to complete than other techniques (since the rate of decay is variable, gamma-ray collection often happens over a period of days).
The restricted availability and cost of this nuclear method make it increasingly difficult to access, and so it has been largely supplanted by ICP-MS.
3.4 Scanning electron microscopy (SEM)
In scanning electron microscopy (SEM), a small sample is placed into a vacuum or near-vacuum and bombarded with a highly focused beam of electrons that is continuously rastered, or scanned, across the surface. Multiple detectors are placed inside the chamber that sense different types of emissions from the surface of the sample as the beam is scanning.
For elemental analysis, SEM may be coupled with X-ray detectors for energy-dispersive spectroscopy (SEM-EDS or SEM-EDX) or wavelength-dispersive spectroscopy (SEM-WDS or microprobe). These detectors yield X-ray spectra that are useful for elemental analysis.17 Areas can be scanned to obtain bulk composition measurements, or spot analysis can be made of individual metallic phases or inclusions. Both techniques are capable of quantitative elemental analysis, although WDS offers substantially higher precision and sensitivity of measurement than EDS.
Samples for quantitative elemental SEM analysis of copper alloys should be at least 1 × 1 mm, but preferably 5 × 5 mm or more to take into account natural inhomogeneities in copper alloys, particularly inhomogeneity of lead (which tends to form globules in copper) and elements associated with it (such as arsenic, silver, and bismuth). Samples are normally embedded in resin, cut, and polished to provide a clean, flat surface for analysis.
Today, many major museum and academic laboratories are equipped with SEM-EDS. These instruments may be valuable for metallographic analysis (see below), but for high-precision, high-sensitivity quantitative elemental analysis, other (unfortunately less accessible) methods such as ICP-AES, ICP-MS, PIXE, SEM-WDS, or NAA (see II.5§3.3) may be preferable.
3.5 How to sample
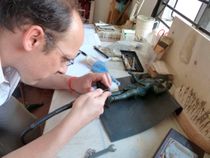
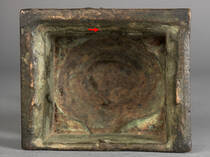
Sampling for elemental alloy analysis (atomic spectroscopies and NAA techniques) is most often done by drilling (fig. 416). Naturally, this is usually carried out in hidden areas of the base or in the interior of the sculpture (fig. 156). A target sample weight of 50 mg of copper alloy represents approximately 5–6 cubic millimeters of metal. If a 1.5 mm–diameter drill bit (steel or tungsten carbide preferred is used, this corresponds to a drilling depth of about 3 mm. If greater depth of drilling is possible, the size of the drill may be reduced correspondingly; for instance, a 1 mm drill bit will provide enough sample if drilled to a depth of about 7 mm, while a 0.6 mm drill bit would require a drilling depth of nearly 20 mm. In practice, this last situation would almost certainly mean drilling multiple holes. It should also be noted that smaller-diameter drills are more likely to break while drilling and, particularly if a is encountered, recovery of the broken end may be difficult or impossible.
When sampling bronze sculpture, drilling is often done on an edge, such that the drill penetrates parallel to the metal wall, avoiding surface effects (see II.5§2.1). For thin-walled sculptures, the thickness of the metal wall may constrain the diameter of drill that can be used; the drill should not be larger than half the wall thickness. Normally the first 0.5 mm of sample material is discarded (drilling depth adjusted accordingly) in order to remove any possibility of surface enhancement or depletion effects. Carefully clean or replace the drill bit between uses.
Preparation of sampled material for analysis is a particularly important step that is usually carried out by the laboratory in charge of the analysis; errors may result if it is not well carried out. Once collected, drillings should be carefully examined under a microscope to remove unwanted materials (corrosion, fibers from clothes, fragments of the drill, et cetera). A magnet may prove useful to remove steel fragments from the drill. For atomic spectroscopies and ICP-MS where the sample will be digested in acid, precise weighing is necessary, and digestion solutions specific to historic copper alloys should be used.18
Sampling for SEM analysis usually follows protocols used for metallography (see II.5§6.2).
4 Choosing a method of elemental analysis
When selecting a technique for elemental analysis, consider your aim. If only major element composition is required, techniques such as XRF may be sufficient. If provenancing and/or fine attribution are required, trace element analysis with the best available sensitivity may be preferable, requiring techniques such as ICP-AES or ICP-MS. Chemical mapping can currently be carried out using XRF, PIXE, LIBS, or LA-ICP-MS, depending on the spatial resolution required (from µm to cm).
Questions of sampling and cost/technique availability are often decisive. Many noninvasive processes, such as XRF, PIXE, and LA, are surface techniques and thus prone to producing results that may not be representative of the bulk metal composition. Corrosion may deeply alter the quantification of alloying elements (for example, a huge tin enrichment due to the selective dissolution of copper). On the other hand, noninvasive techniques tend to be rapid, and the cost of undertaking repeated measurements is low, allowing measurement of more sample sites in different surface areas.
In contrast to noninvasive techniques, invasive techniques that require drilling will represent the bulk metal well, even if surfaces are enhanced, depleted, or contaminated. Their disadvantage is that the damage done by drilling, and the relatively high cost per sample, means that very few analyses are usually carried out, and these are usually constrained to the lower regions of the sculpture. Particularly if the sculpture is composed of several separately sections, this means the results may not reflect the overall composition.
In summary, noninvasive techniques are vulnerable to depth inhomogeneity, while invasive techniques are vulnerable to spatial inhomogeneity but provide better sensitivities (which also means more elements are analyzed). In this sense, the two types are complementary. A particularly complementary and practical pairing is XRF alongside ICP-AES or ICP-MS. Initial study with XRF on many points of a sculpture can characterize gross overall (in)homogeneity and identify differences in composition between separately cast sections and/or areas of repair. The XRF results may also inform the choice of sample site(s) for drilling. Naturally, radiography and visual examination of the interior and exterior should also inform the choice of sampling sites. ICP analysis will provide additional information on trace elements and may help identify any layer inhomogeneity issues that could affect the XRF results.
XRF analysis may also confirm the validity of ICP results. In one instance, serious procedural errors in two ICP-MS results were detected by one of the authors when XRF results were found to be dramatically different that those reported by ICP. The errors were subsequently identified and confirmed by the commercial ICP laboratory, but would never have been noticed if not for the complementary XRF study.
It is often stated that analyses carried out by different teams cannot be compared, but this is simply not true if the methods are regularly controlled by the use of relevant certified reference materials, and the methodologies and results are published in relevant peer-reviewed journals. This has unfortunately not been standard practice for long, but the trend is clearly toward a greater emphasis on comparability, reproducibility, and transparency in analytical methods and reporting.19
5 Isotope analysis
5.1 Scientific principles
Atoms are made of a nucleus around which a “cloud” of electrons spins. The nucleus is made of two main types of particles, protons and neutrons, and the number of protons defines the element. Copper, for example, has 29 protons, tin has 50, and lead has 82. The number of neutrons in the nucleus of any given element can vary within a certain range, and this number of neutrons determines the isotope. Isotopes are designated according to the combined number of protons and neutrons in the core (the atomic weight). So, for example, a lead atom (Pb) with 82 protons and 122 neutrons is designated 204Pb. Some isotopes are stable and do not change over time. Others are not stable (these are radioactive) and will decay at a predictable rate into other elements by loss of nuclear particles and energy. Carbon-14, or 14C, is a well-known example of an unstable isotope that is used for radiocarbon dating purposes (see II.8§2).
Isotope analysis for bronze sculpture focuses on the quantification of different stable isotopes.20 The total amount of any given isotope in a copper alloy may be extremely small. For instance, in unalloyed copper, an important lead isotope, 204Pb (see II.5§5.2), may be present in quantities around 0.0001 wt% (1 ppm). A sensitive technique is thus needed, typically mass spectrometry. In addition, the difference in isotope ratios between two copper deposits is often very small, thus requiring mass measurements with very high precision (around 0.1%) that only certain types of advanced mass spectrometers can achieve. Typically, so-called multicollectors (MC) are used and the technique is referred to as MC-ICP-MS.
5.2 Application to bronze sculpture
Lead, a well-studied isotope series, has four stable isotopes as well as scores of unstable isotopes. The stable isotopes, however, make up nearly all the lead on Earth and are 204Pb, 206Pb, 207Pb, 208Pb. Depending on the age, geological location, and nature of the ore from which it is derived, lead metal contains different proportions of these different isotopes. Small amounts of lead are systematically present in copper as a natural impurity, so lead isotope studies on copper artifacts are often designed to study the geographic origin of the copper. Conventionally, the ratios 206Pb/204Pb, 207Pb/204Pb, and 208Pb/204Pb are used for describing results.
Few isotope analyses have thus far been carried out on bronze sculpture. The main applications have been lead isotope studies on ancient copper alloy artifacts—mainly protohistoric collections of weapons, tools, and/or everyday items.21 Tin isotopes have recently become a focus of greater study in the context of bronze artifacts, while zinc and copper isotopes have potential applications, but have not been widely used.22 In the long run, the study of several isotope series in combination will probably be more informative than an examination of lead alone.
Using MC-ICP-MS analysis, very small sample sizes are needed, often less than 10 mg. Samples may be obtained by drilling as described in II.5§3.5.
5.3 Cost and availability
Isotopic analysis for copper alloys is mostly carried out in earth science laboratories. In 2023, the cost of one analysis ranged from US$100 to $300.
5.4 Risks of misinterpretation
The provenancing of copper based on lead stable isotope analysis alone is far from straightforward.23 Isotope analysis is probably best used as a complementary approach together with elemental analysis, archaeology, and/or history.
Another major issue in applying isotope analysis to bronze sculpture is that lead is commonly added to the copper by or even by the metal supplier, be it through direct addition or recycling. In this case, the lead isotope signature will reflect not the provenance of the copper but rather that of the lead. In bronze sculpture, it may not always be evident whether low levels of lead are naturally occurring or added. Rather than focusing on geographic provenancing of metal, isotope analysis may be better suited to authentication and attribution, by characterizing expected isotope ratios for different regions and time periods. This will only be possible if large numbers of well-provenanced sculptures are studied in the future.
6 Metallography
6.1 Scientific principles
Metallography is the study of metal microstructure using microscopic imaging techniques.24 Microstructure, its interpretation, and its importance for the study of bronze sculpture is discussed in I.2§3. The reader may consult that section to learn about the types of information to be gleaned from metallographic study and evaluate whether such study is worth undertaking.
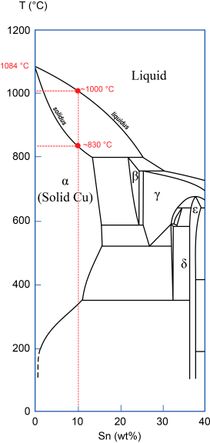
In the field of cultural heritage, metallographic analysis is often confused with elemental metal analysis, but the two are quite different. In addition to the study of the metallurgical state of the metal, metallography might determine the different phases and their distributions. When two or more metals are mixed together to form an alloy—for example, copper and tin—different phases may form depending on the relative proportions of the different ingredients and the cooling temperature. Phase diagrams are useful to infer what phases may form and the nature and variety of the properties of the alloys, including melting temperatures and freezing ranges (fig. 132).25
A metallography study involves two main steps: sampling and preparation, followed by observation and analysis.
6.2 Sampling and preparation
In situ characterization of microstructure without sampling is rarely relevant, for several reasons. First, the microstructure of the bronze’s surface is rarely what requires observation. A cross section of the metal wall is often much more informative, as it may show joints, repairs, et cetera. Also, the original surface may be severely altered by wear, use, later interventions, and/or corrosion. Second, a proper polishing is difficult to achieve in situ. (Several attempts have been carried out to develop pre-polishing and diamond or alumina polishing using rotary abrasive heads.) Third, in situ observation is very limiting in terms of magnification and image quality. Fourth, the surface to be prepared and etched must be large enough to encompass the heterogeneity of the microstructure (at least 1 × 1 cm).
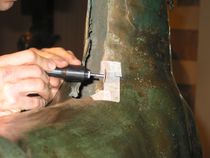
Metallography on an extracted sample is the standard method. For hollow bronzes, a transverse section is usually required, extending over the whole thickness of the wall. The section can be as narrow as possible (approx. 1 mm), and its length depends on the questions to be addressed (5–20 mm, for instance a weld joint), such that enough surface is covered to enable a fully representative study. The choice of sample site is obviously crucial. Bronze is hard, and metal walls on a sculpture are often several millimeters thick. A diamond saw mounted on a drilling machine is generally the best tool (figs. 417, 418). Great care must be taken when sampling to preserve the structure of surface layers (see II.6§3.1).
The preparation of the cross section may be as follows. The cross section is embedded in resin (often epoxies or acrylates), pre-polished using silicon carbide papers of different grades, then polished on cloths to a mirror surface, either with alumina or diamond paste. Many microstructural features may be observed optically, directly on a polished surface. SEM examination is also usually conducted directly on the polished sample.
In order to reveal particular features, a solution made of various acids and/or bases may be applied to the surface of the cross section. This is called etching. Etching solutions react chemically with some specific parts of the microstructure such as grain boundaries, and thus reveal these features by either removing them or coloring them. The optimal etching solution depends on both the type of copper alloy and the features under investigation. Etching is discussed at length in Scott, David A. 1991. Metallography and Microstructure of Ancient and Historic Metals. Marina del Rey, CA: Getty Conservation Institute in association with Archetype Books..26 Before etching, make sure to observe and record all the microstructural features that are best observed without etching, or else repolishing will be necessary.
6.3 Observation and analysis
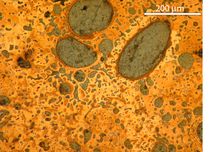
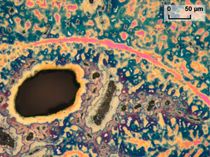
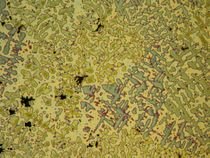
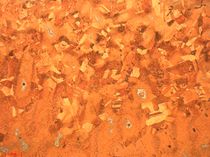
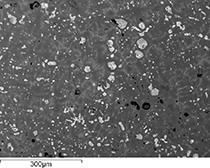
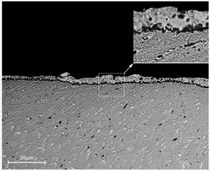
The polished cross sections should first be examined using an optical microscope both to get an overview of the microstructure and/or surface layers (fig. 146) and to estimate their homogeneity or heterogeneity. There are advantages to the specificities of this technique. Two viewing modes are possible. In bright field conditions (specular light), metallic and nonmetallic inclusions can be visible, as can different metals, such as gilding layers. This is usually done before etching. Bright field mode also enables the clear visualization of relief generated by etching as well as the colors of the microstructure generated by etching (figs. 142, 145, 419, 420). Dark field (diffuse reflectance) is rarely used for microstructural observation, but rather for the investigation of surface layers, patina, gilding, and , similar to stratigraphic cross sections used in the study of paintings.
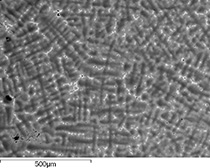
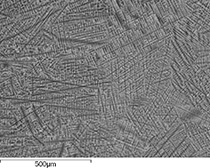
Scanning electronic microscopy (see II.5§3.4) may be required for higher magnification and for elemental analysis of inclusions, metallic phases, and/or surface layers (figs. 421, 422, 423, 424). Some SEM instruments may allow for electron back-scattered diffraction (EBSD) structural analysis as well.27
Metallography is a highly invasive procedure and (as explained in I.2§3.3) should only be considered if it will answer very specific questions. As with most other analytical techniques mentioned in these Guidelines, a minimum of skills and techniques (for sampling, preparation, observation, and interpretation) is mandatory to ensure that the most valuable information is gathered.
Notes
-
Bevington, Philip R., and D. Keith Robinson. 2003. Data Reduction and Error Analysis for the Physical Sciences. Boston: McGraw-Hill., 1–14; ISO. 2008. “Uncertainty of Measurement — Part 3: Guide to the Expression of Uncertainty in Measurement (GUM:1995).” ISO/IEC Guide 98-3:2008. Geneva: International Organization for Standardization. https://www.iso.org/standard/50461.html.; Pilon, Fabien, Alexandre Labet, Karine Vielle, Olivier Vigneau, Guy Granier, Philippe Bienvenu, and Jean-Michel Mermet. 2017. La validation de méthode en spectrométrie d’émission optique à source plasma: De l’échantillon au résultat. La validation de méthode en spectrométrie d’émission optique à source plasma. Les Ulis: EDP Sciences. https://doi.org/10.1051/978-2-7598-2083-2.. ↩︎
-
Ekins, Roger, and Philip Edwards. 1997. “Point on the Meaning of ‘Sensitivity.’” Clinical Chemistry 43 (10): 1824–31.. ↩︎
-
Pollard, A. M., P. Bray, A. Cuénod, P. Hommel, Y.-K. Hsu, R. Liu, L. Perucchetti, J. Pouncett, and M. Saunders. 2018. “The Flame GIS-Database.” In Beyond Provenance: New Approaches to Interpreting the Chemistry of Archaeological Copper Alloys, edited by A. M. Pollard, 171–86. Studies in Archaeological Sciences 6. Leuven, Belgium: Leuven University Press. https://doi.org/10.2307/j.ctv7xbs5r.10.. ↩︎
-
Heginbotham, Arlen, Aniko Bezur, Michel Bouchard, Jeffrey M. Davis, Katherine Eremin, James H. Frantz, Lisha Glinsman et al. 2011. “An Evaluation of Inter-Laboratory Reproducibility for Quantitative XRF of Historic Copper Alloys.” In Metal 2010: Proceedings of the Interim Meeting of the ICOM-CC Metal Working Group, October 11–15, 2010, Charleston, South Carolina, USA, edited by Paul Mardikian, Claudia Chemello, Christopher Watters, and Peter Hull, 244–55. Clemson, SC: Clemson University Press. https://repository.si.edu/handle/10088/90692. ↩︎
-
Heginbotham, Arlen, Jane Bassett, David Bourgarit, Chris Eveleigh, Lisha Glinsman et al. 2014. “The Copper CHARM Set: A New Set of Certified Reference Materials for the Standardization of Quantitative X-Ray Fluorescence Analysis of Heritage Copper Alloys.” Archaeometry 57 (5): 856–68.; Heginbotham, Arlen, and V. Armando Solé. 2017. “CHARMed PyMca, Part I: A Protocol for Improved Inter-Laboratory Reproducibility in the Quantitative ED-XRF Analysis of Copper Alloys.” Archaeometry 59 (4): 714–30. https://doi.org/10.1111/arcm.12282.; Heginbotham, Arlen, David Bourgarit, Julia Day, Jan Dorscheid, Joe Godla, Lynn Lee, Arie Pappot, and Dominique Robcis. 2019. “CHARMed PyMca, Part II: An Evaluation of Interlaboratory Reproducibility for ED‐XRF Analysis of Copper Alloys.” Archaeometry 61 (6): 1333–52. https://doi.org/10.1111/arcm.12488.. ↩︎
-
For more on the study pictured in figure 414 see Mille, Benoît. 2019a. “Forme, matière et couleurs de la petite statuaire du Trésor de Bavay, mise en évidence d’innovations techniques au service de la création artistique romaine.” In Nouveaux regards sur le Trésor des bronzes de Bavay, edited by Laure de Chavagnac and Benoît Mille, 166–89. Milan: Silvana Editoriale., 182–85; Laval, Eric, Thomas Calligaro, and Benoît Mille. 2019. “Mise en évidence de la polychromie métallique des statuettes de Bavay par cartographie de fluorescence X.” In Nouveaux regards sur le trésor des bronzes de Bavay, edited by Laure de Chavagnac and Benoît Mille, 196–97. Milan: Silvana Editoriale.. ↩︎
-
For more detailed discussion of parameters affecting XRF of bronze sculpture see Smith, Dylan. 2012. “Handheld X-Ray Fluorescence Analysis of Renaissance Bronzes: Practical Approaches to Quantification and Acquisition.” In Handheld XRF for Art and Archaeology, edited by Aaron N. Shugar and Jennifer L. Mass, 37–74. Leuven, Belgium: Leuven University Press.. ↩︎
-
Calligaro, Thomas, Yvan Coquinot, Laurent Pichon, and B. Moignard. 2011. “Advances in Elemental Imaging of Rocks Using the AGLAE External Microbeam.” Nuclear Instruments and Methods in Physics Research Section B-Beam Interactions with Materials and Atoms 269 (20): 2364–72.; Calligaro, Thomas, Jean-Claude Dran, Evanthia Ioannidou, Brice Moignard, Laurent Pichon, and Joseph Salomon. 2000. “Development of an External Beam Nuclear Microprobe on the AGLAE Facility of the Louvre Museum.” Nuclear Instruments and Methods in Physics Research Section B 161/162/163:328–33.; Dran, Jean-Claude, Thomas Calligaro, and Joseph Salomon. 2000. “Particle-Induced X-Ray Emission.” In Modern Analytical Methods in Art and Archaeology, edited by Enrico Ciliberto and Giuseppe Spoto, 135–66. New York: Wiley-Interscience.. ↩︎
-
Done notably on medieval Iranian bronzes to analyze the metal inlays (Collinet, Annabelle. 2021. Précieuses matières: L’art du métal dans le monde iranien médiéval. Dijon: Éditions Faton.) and on a Roman statuette (Pacheco, Claire, and Benoît Mille. 2019. “Le Nouvel AGLAE pour scruter l’épiderme du chien (ou loup ?) de Bavay.” In Nouveaux regards sur le Trésor des bronzes de Bavay, edited by Laure de Chavagnac and Benoît Mille, 192–93. Milan: Silvana Editoriale.). ↩︎
-
Alberghina, M. F., R. Barraco, M. Brai, T. Schillaci, and L. Tranchina. 2011. “Comparison of LIBS and μ-XRF Measurements on Bronze Alloys for Monitoring Plasma Effects.” Journal of Physics: Conference Series 275 (January): 012017. https://doi.org/10.1088/1742-6596/275/1/012017.; Gaudiuso, Rosalba, Marcella dell’Aglio, Olga de Pascale, Giorgio S. Senesi, and Alessandro de Giacomo. 2010. “Laser Induced Breakdown Spectroscopy for Elemental Analysis in Environmental, Cultural Heritage and Space Applications: A Review of Methods and Results.” Sensors 10 (8): 7434–68. https://doi.org/10.3390/s100807434.. ↩︎
-
Mille, Benoît, Loretta Rossetti, Claude Rolley (†), Edilberto Formigli, and Michel Pernot. 2012. “Les deux statues d’enfant en bronze (Cap d’Adge): Étude Iconographique et Technique.” In “Bronzes grecs et romains, recherches récentes” – Hommage à Claude Rolley, edited by Sophie Descamps-Lequime, Stéphane Verger, and Martine Denoyelle. Actes de Colloques. Paris: Publications de l’Institut national d’histoire de l’art. http://books.openedition.org/inha/3949.. ↩︎
-
Van Langh, Robert. 2012. “Technical Studies of Renaissance Bronzes: The Use of Neutron Imaging and Time-of-Flight Neutron Diffraction in the Studies of the Manufacture and Determination of Historical Copper and Alloys.” PhD diss., Delft University of Technology. http://resolver.tudelft.nl/uuid:3898ae1c-7934-4d85-a0db-628760739b50.; Peetermans, Steven, Robert van Langh, Eberhard Lehmann, and Arie Pappot. 2012. “Quantification of the Material Composition of Historical Copper Alloys by Means of Neutron Transmission Measurements.” Journal of Analytical Atomic Spectrometry 27 (10): 1674–79.. ↩︎
-
Van Langh, R., L. Bartoli, J. Santisteban, and D. Visser. 2011. “Casting Technology of Renaissance Bronze Statuettes: The Use of TOF-Neutron Diffraction for Studying Afterwork of Renaissance Casting Techniques.” Journal of Analytical Atomic Spectrometry 26 (5): 892–98.. ↩︎
-
Pernicka, Ernst. 2014. “Provenance Determination of Archaeological Metal Objects.” In Archaeometallurgy in Global Perspective, edited by Benjamin W. Roberts and Christopher P. Thornton, 239–68. New York: Springer.; Killick, David. 2015. “Archaeometallurgy as Archaeology.” In Archaeometallurgy in Europe III, Proceedings of the 3rd International Conference, Deutsches Bergbau-Museum Bochum, June 29–July 1, edited by Andreas Hauptmann and Diana Modarressi-Tehrani, 295–300. Bochum, Germany: Deutsches Bergbau Museum.. ↩︎
-
See notably all the work carried out at the Rathgen-Forschungslabor der Staatlichen Museen zu Berlin (Riederer, Josef. 2002. “Die Datenbank zu Metallanalysen des Rathgen-Forschungslabors. Ein Beitrag zur Erschließung kulturgeschichtlicher Objekte.” Jahrbuch Preussischer Kulturbesitz 39:329–44.) and at the C2RMF (Mille, Benoît, and David Bourgarit. 2000. “L’analyse des alliages anciens à base de cuivre: État des connaissances et développement d’un protocole d’analyse par ICP-AES.” Revue d’archéométrie 24:13–26.; Bourgarit, David, and Benoît Mille. 2003. “The Elemental Analysis of Ancient Copper-Based Artefacts by Inductively-Coupled-Plasma Atomic-Emission Spectrometry: An Optimized Methodology Reveals Some Secrets of the Vix Crater.” Measurement Science and Technology 14 (9): 1538-1555. https://doi.org/10.1088/0957-0233/14/9/306.). ↩︎
-
Pollard, A. M., B. Stern, C. M. Batt, and S. M. M. Young. 2007. “Inductively Coupled Plasma–Mass Spectrometry (ICP–MS).” In Analytical Chemistry in Archaeology, 195–214. Cambridge Manuals in Archaeology. Cambridge, UK: Cambridge University Press.. ↩︎
-
Mugnaini, Sonia, Marco Giamello, Anastasia Pisani, and Salvatore Siano. 2014. “Casting Cores Used to Craft Large Bronze Masterpieces of the Florentine Renaissance and Mannerism.” Journal of Archaeological Science 47 (July): 85–98.; Lombardi, Gianni. 2009. “The Casting Core Composition and Provenance of the Goljamata Kosmatka (Bulgaria) Bronze Head.” Journal of Archaeological Science 36 (2): 520–27.; Vincent, B. 2014. “Searching for the Bronze Workshops of Angkorian Cambodia: Petrographic Study Applied to Casting Cores of 11th–12th C. Khmer Bronzes” (unpublished report). Washington, DC: Freer Gallery of Art and Arthur M Sackler Gallery.. ↩︎
-
Notably to make sure all the silver, possibly present in relatively high amounts, is correctly dissolved. See Bourgarit, David, and Benoît Mille. 2003. “The Elemental Analysis of Ancient Copper-Based Artefacts by Inductively-Coupled-Plasma Atomic-Emission Spectrometry: An Optimized Methodology Reveals Some Secrets of the Vix Crater.” Measurement Science and Technology 14 (9): 1538-1555. https://doi.org/10.1088/0957-0233/14/9/306.. ↩︎
-
Heginbotham, Arlen, and V. Armando Solé. 2017. “CHARMed PyMca, Part I: A Protocol for Improved Inter-Laboratory Reproducibility in the Quantitative ED-XRF Analysis of Copper Alloys.” Archaeometry 59 (4): 714–30. https://doi.org/10.1111/arcm.12282.; Heginbotham, Arlen, David Bourgarit, Julia Day, Jan Dorscheid, Joe Godla, Lynn Lee, Arie Pappot, and Dominique Robcis. 2019. “CHARMed PyMca, Part II: An Evaluation of Interlaboratory Reproducibility for ED‐XRF Analysis of Copper Alloys.” Archaeometry 61 (6): 1333–52. https://doi.org/10.1111/arcm.12488.. ↩︎
-
For a comprehensive overview of isotope analysis applications in cultural heritage see Nord, Anders G., and Kjell Billström. 2018. “Isotopes in Cultural Heritage: Present and Future Possibilities.” Heritage Science 6 (25): https://heritagesciencejournal.springeropen.com/articles/10.1186/s40494-018-0192-3. https://doi.org/10.1186/s40494-018-0192-3.. ↩︎
-
See Artioli, Gilberto. 2010. Scientific Methods and Cultural Heritage: An Introduction to the Application of Materials Science to Archaeometry and Conservation Science. Oxford and New York: Oxford University Press.. ↩︎
-
Stephens, J. A., M. N. Ducea, D. J. Killick, and J. Ruiz. 2021. “Use of Non-Traditional Heavy Stable Isotopes in Archaeological Research.” Journal of Archaeological Science 127 (March): 105334.. ↩︎
-
Artioli, G., C. Canovaro, P. Nimis, and I. Angelini. 2020. “LIA of Prehistoric Metals in the Central Mediterranean Area: A Review.” Archaeometry 62 (S1): 53–85. https://doi.org/10.1111/arcm.12542.; Pollard, A. Mark. 2009. “What a Long, Strange Trip It’s Been: Lead Isotopes and Archaeology.” In From Mine to Microscope, edited by Andrew J. Shortland, Ian C. Freestone, and Thilo Rehren, 181–89. Oxford: Oxbow Books.; Gale, Noël H. 2009. “A Response to the Paper of A. M. Pollard: What a Long, Strange Trip It’s Been: Lead Isotopes and Archaeology.” In From Mine to Microscope, edited by Andrew J. Shortland, Ian C. Freestone, and Thilo Rehren, 191–95. Oxford: Oxbow Books.. ↩︎
-
Metallographic studies recently celebrated their 150th birthday (Philibert, Jean. 2014. “Cent cinquante ans de metallographie.” SF2M Info, March 2014, 1–2.). See also the interesting lecture by J.-M. Lago on the history of optical microscopy at the conference “150 ans de la métallographie,” March 21, 2014, Paris, http://docplayer.fr/4477079-J-m-lago-150-ans-de-metallographie-a-toutes-les-echelles-2.html. ↩︎
-
The most common diagrams for ancient copper alloys are reported and commented upon in Scott, David A. 1991. Metallography and Microstructure of Ancient and Historic Metals. Marina del Rey, CA: Getty Conservation Institute in association with Archetype Books.. ↩︎
-
Scott, David A. 1991. Metallography and Microstructure of Ancient and Historic Metals. Marina del Rey, CA: Getty Conservation Institute in association with Archetype Books., 69–74. ↩︎
-
Baudin, Thierry. 2011. “Analyse EBSD Déformation et recristallisation des matériaux métalliques.” Techniques de l’ingénieur Essais métallographiques des métaux et alliages base documentaire: TIB343DUO (ref. article: m4139). https://doi.org/10.51257/a-v1-m4139.; Northover, Shirley. M., and J. Peter Northover. 2012. “Applications of Electron Backscatter Diffraction (EBSD) in Archaeology.” In Historical Technology, Materials and Conservation: SEM and Microanalysis, edited by Nigel Meeks, Caroline Cartwright, Andrew Meek, and Aude Mongiatti, Archetype Publications, 76–85. London. http://oro.open.ac.uk/27052/5/Applns EBSD in archae revised with figs.pdf.. ↩︎