The Analysis of Ancient Glass
One of the greatest technological achievements of the ancient world was the transition in glassmaking from mold-formed to free-blown objects. This development allowed glass to change from a luxury item to a widely available, everyday material that permeated all levels of society. Today, the study of ancient glass likewise benefits from technological advancements. Advanced instrumental techniques allow the composition of glass to be measured with increased precision and speed, and lower limits of detection. Advanced statistical data treatment methods enable researchers to better link the material findings with production methods, chronology, location, and degree of recycling. These findings in turn provide insight into the sociopolitical and economic impact of glass in the ancient world.
However, detailed analytical measurements typically depend on the ability to remove a sample of the glass for testing. Sampling from fragmentary archaeological specimens is usually permitted, as material removed from already broken edges generally will not impact the ability of the piece to provide archeological information. Such samples enable a complete and precise determination of the elemental composition of the glass, when scientists employ techniques such as scanning electron microscopy with energy dispersive spectroscopy (SEM-EDS), electron probe micro-analysis (EPMA), solution-based inductively coupled plasma mass spectrometry (ICP-MS), and laser ablation ICP-MS (LA-ICP-MS). This compositional information sheds light on the glassmaking process by identifying the type of base glass used and the types of colorants added to achieve the final product. Other analytical techniques, such as thermal ionization mass spectroscopy (TIMS) and multi-collector ICP-MS, allow even more in-depth analysis, providing isotopic information that can be used to infer the provenance of the raw materials, potential workshop locations, and/or commercial links between countries and cultures. All together, these analytical techniques allow scholars to draw a more complete picture of the glassmaking process at a specific time and place.
By contrast, glass objects in museum collections are typically less available for sampling, as removing even small amounts of material may impact the visual appearance of the object. While SEM-EDS and EPMA are noninvasive techniques (i.e., they do not require taking a sample of the item), the size of the objects that can be studied is limited by the dimensions of the instrument chamber. Similarly, although LA-ICP-MS is considered a micro-invasive technique, its use on museum objects is limited because small, but visible, ablation spots accompanied by discoloration can occur, compromising the visual integrity of the object.
This dichotomy—that the availability of samples from fragmentary archaeological materials allows a fully quantitative characterization of the glass, while only a more limited understanding of complete glass objects from museum collections is currently achievable—has introduced a bias into the study of archaeological glass, the result being that those objects which, for whatever reason, have better survived the challenge of time are underrepresented in the data set.
To overcome this bias, the application of X-ray fluorescence
(XRF) spectroscopy, a noninvasive technique that allows in
situ elemental characterization of objects of almost any size
or shape, has become more common (Adlington, L. W., I. C. Freestone, and L. Seliger. 2021.
“Dating Nathan: The Oldest Stained Glass Window in
England?” Heritage 4: 937–960.;
Adlington, L., I. Freestone, L. Seliger, M.
Martinón-Torres, F. Brock, and A. Shortland. 2020. “In
Situ Methodology for Compositional Grouping of Medieval
Stained Glass Windows.”
Cambridge Scholars Publishing.
https://discovery.ucl.ac.uk/id/eprint
In the study presented here, twenty-four core-formed vessels from the collection of the J. Paul Getty Museum were studied using XRF spectroscopy coupled with statistical analysis (Principal Component Analysis [PCA]) to extract key compositional information without the need for quantification.1 This approach allows similarities and differences in glass of different colors, shapes, and time periods to be relatively easily assessed, from which the glassmaking technology may be inferred. The results, although derived from a relatively small group of vessels, demonstrate the validity of the approach, and expand our current knowledge on glassmaking technology from the sixth to the first centuries BCE.
| Acc. Number | Typology | Attributed Date | Colors Analyzed |
|---|---|---|---|
| 2003.165 | Oinochoe | Fourth–third century BCE | Blue, yellow, turquoise |
| 2003.167 | Oinochoe | Fourth–third century BCE | Blue, turquoise, white |
| 2003.169 | Amphoriskos | Sixth–fifth century BCE | Dark green, white, turquoise |
| 2003.170 | Amphoriskos | Fifth century BCE | Red, turquoise, yellow, white |
| 2003.171 | Amphoriskos | Sixth–fifth century BCE | Blue, orange, turquoise |
| 2003.172 | Amphoriskos | Sixth–fifth century BCE | Blue, yellow |
| 2003.175 | Amphoriskos | Sixth–fifth century BCE | Black, white |
| 2003.176 | Aryballos | Sixth–fifth century BCE | Blue, orange, white |
| 2003.180 | Alabastron | Sixth–fifth century BCE | White, purple |
| 2003.183 | Alabastron | Fifth century BCE | Dark color (purple), white |
| 2003.184 | Alabastron | Fifth century BCE | Brown, turquoise, yellow |
| 2003.187 | Alabastron | Fourth–third century BCE | Blue, yellow |
| 2003.189 | Alabastron | Fifth century BCE | Brown, turquoise, yellow |
| 2003.193 | Alabastron | Fourth–third century BCE | Blue, yellow, turquoise, white |
| 2003.194 | Alabastron | Second–first century BCE | Black, white |
| 2003.195 | Alabastron | Second–first century BCE | Blue, light blue |
| 2003.196 | Alabastron | Sixth–fifth century BCE | Blue, turquoise, yellow |
| 2003.197 | Alabastron | Second–first century BCE | Blue, turquoise, yellow |
| 2003.198 | Alabastron | Second–first century BCE | Blue, white |
| 2003.199 | Alabastron | Second–first century BCE | Blue, white, yellow |
| 2003.201 | Amphoriskos | Second–first century BCE | Blue, yellow, amber, white |
| 2003.203 | Amphoriskos | Third century BCE | Blue, white, yellow |
| 2004.6 | Alabastron | Fifth century BCE | Dark (purple), white |
| 2004.8 | Alabastron | Fourth–third century BCE | Blue, yellow |
The Shapes and Colors of Core-Formed Vessels
Often referred to as the “Mediterranean group,” core-formed vessels first appeared in the sixth century BCE and continued to be made until the middle of the first century BCE (McClellan, Murray. 1984. “Core-Formed Glass from Dated Contexts.” PhD diss., University of Pennsylvania, Philadelphia.; Harden, Donald B. 1981. Catalogue of Greek and Roman Glass in the British Museum, vol. 1: Core- and Rod-Formed Vessels and Pendants and Mycenean Cast Objects. London: British Museum.). Three subgroups are defined based on their chronology and likely location of production: Group 1 includes objects produced in the sixth and fifth centuries BCE, the majority of which have been found on the island of Rhodes (Harden, Donald B. 1981. Catalogue of Greek and Roman Glass in the British Museum, vol. 1: Core- and Rod-Formed Vessels and Pendants and Mycenean Cast Objects. London: British Museum.; Shortland, A. J., and H. Schroeder. 2009. “Analysis of First Millennium BC Glass Vessels and Beads from the Pichvnari Necropolis, Georgia.” Archaeometry 51: 947–965.; Rehren, T., L. Spencer, and P. Triantafyllidis. 2005. “The Primary Production of Glass at Hellenistic Rhodes.” In Annales du 16e Congres de l’Association Internationale pour l’Histoire du Verre, London, 7–13 September 2003, 39–43. Nottingham: AIHV.; Triantafyllidis, Pavlos. 2009. “Early Core-Formed Glass from a Tomb at Ialysos, Rhodes.” Journal of Glass Studies 51: 26–39.). Group 2 includes objects produced in the fourth and third centuries BCE; these vessels were probably produced in multiple workshops and are found predominantly in mainland Greece, as well as in Magna Graecia (central and southern Italy), and less often on the Greek islands (Harden, Donald B. 1981. Catalogue of Greek and Roman Glass in the British Museum, vol. 1: Core- and Rod-Formed Vessels and Pendants and Mycenean Cast Objects. London: British Museum.). Lastly, Group 3 includes vessels produced between the second century and the middle of the first century BCE, with production centers in Cyprus and on the Phoenician coast (McClellan, Murray. 1984. “Core-Formed Glass from Dated Contexts.” PhD diss., University of Pennsylvania, Philadelphia.; Harden, Donald B. 1981. Catalogue of Greek and Roman Glass in the British Museum, vol. 1: Core- and Rod-Formed Vessels and Pendants and Mycenean Cast Objects. London: British Museum.; Jackson-Tal, R. E. 2004. “The Late Hellenistic Glass Industry in Syro-Palestine: A Reappraisal.” Journal of Glass Studies 46: 11–32.). The production of core-formed vessels ceased with the discovery and spread of glassblowing, which by the first century CE had widely superseded the core-forming technique.
Core-formed vessels were produced in a limited number of shapes, the most common being alabastra, amphoriskoi, aryballoi, oinochoae, and one unguentarium (see Fig. 21) (McClellan, Murray. 1984. “Core-Formed Glass from Dated Contexts.” PhD diss., University of Pennsylvania, Philadelphia.; Harden, Donald B. 1981. Catalogue of Greek and Roman Glass in the British Museum, vol. 1: Core- and Rod-Formed Vessels and Pendants and Mycenean Cast Objects. London: British Museum.). The size and volume of the different types of vessels is relatively consistent throughout the six centuries of manufacturing, suggesting a standardized production process across the many glassworking centers throughout the Mediterranean (Cosyns, P., B. Verhelst, and K. Nys. 2017. “Capacity Measurement to Demonstrate Standardized Productions of the Core-Formed Vessels from the Late Archaic to the Late Hellenistic Period: An Interim Report.” In Annales du 20e Congrès de l’Association Internationale pour l’Histoire du Verre, Friboug-Romont, 7–11 septembre 2015, ed. Sofie Wolf and Ann de Pury-Gysel, 43–47. Rahden: Marie Leidorf.). In addition to size and shape, the iconic color scheme—with vessels being either of a dark blue glass decorated with applied white, yellow, and turquoise trails, or of a milky white glass decorated with purple trails—also seems to have been standardized (Harden, Donald B. 1981. Catalogue of Greek and Roman Glass in the British Museum, vol. 1: Core- and Rod-Formed Vessels and Pendants and Mycenean Cast Objects. London: British Museum.; McClellan, Murray. 1984. “Core-Formed Glass from Dated Contexts.” PhD diss., University of Pennsylvania, Philadelphia.).
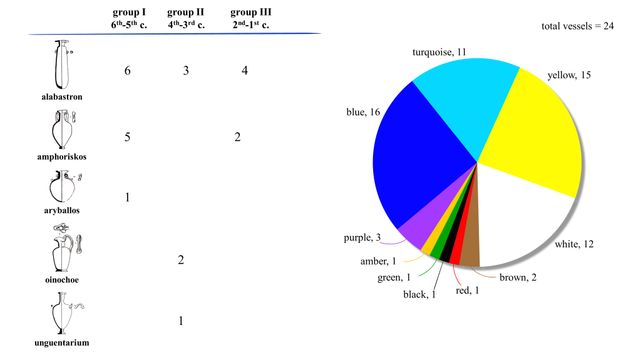
The twenty-four core-formed vessels in this study were selected to include representatives of all four main shapes and a wide range of colors. In total, ten colors (blue, turquoise, yellow, white, purple, brown, red, black, amber-color, green), with blue, turquoise, yellow, and white being the most common, are represented. Figure 21 shows how the vessels investigated are broken down according to typology, chronology, and color.2
The deep, bright colors typical of core-formed vessels were achieved by adding colorants and opacifiers, in the form of naturally occurring minerals, to the glass melt (see Fig. 22). For example, adding the element antimony (most commonly in the form of the mineral stibnite (Sb2S3)) to the glass melt produces an opaque white glass if calcium is also added, through the formation of calcium antimonate crystals (Nicholson, P. T., and I. Shaw. 2000. Ancient Egyptian Materials and Technology. Cambridge: Cambridge University Press.; Henderson, J. 2013. The Science and Archaeology of Materials: An Investigation of Inorganic Materials. London: Routledge.; Shortland, A. J. 2002. “The Use and Origin of Antimonate Colorants in Early Egyptian Glass.” Archaeometry 44: 517–530.; Lahlil, S., I. Biron, L. Galoisy, and G. Morin. 2009. “Technological Processes to Produce Antimonate Opacified Glass throughout History.” In Annales du 17e Congrès de l’Association Internationale pour l’Histoire du Verre, Antwerp, 2006, ed. Koen Janssens, 571–578. Brussels: University Press Antwerp.). However, if lead is added instead of calcium, the antimony will form lead antimonate crystals, which give an opaque yellow appearance to the glass. Both white calcium antimonate and yellow lead antimonate are well known opacifiers of ancient glass, having been used from the beginning of glass production in the Near East and Egypt around 1500 BCE (Nicholson, P. T., and I. Shaw. 2000. Ancient Egyptian Materials and Technology. Cambridge: Cambridge University Press.; Tite, M., T. Pradell, and A. Shortland. 2008. “Discovery, Production, and Use of Tin-Based Opacifiers in Glasses, Enamels, and Glazes from the Late Iron Age Onwards: A Reassessment.” Archaeometry 50: 67–84.; Shortland, A. J. 2002. “The Use and Origin of Antimonate Colorants in Early Egyptian Glass.” Archaeometry 44: 517–530.; Arletti, R., A. Ciarallo, S. Quartieri, G. Sabatino, and G. Vezzalini. 2006. “Archaeometric Analyses of Game Counters from Pompeii.” Geological Society, London, Special Publications 257: 175–186.).
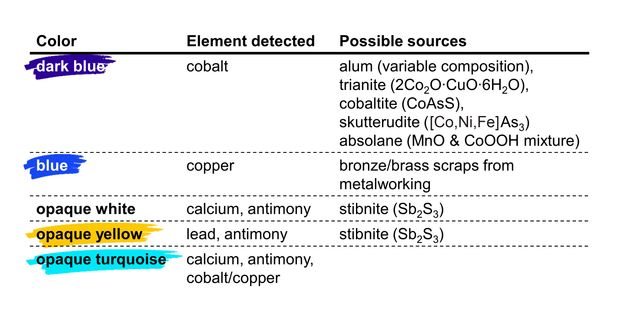
Blue glass could be made in multiple ways. Most common was the addition of cobalt-containing minerals, such as alum (a composite mineral with variable composition that can contain significant amounts of manganese, zinc, nickel, and aluminum: Kaczmarczyk, A. 1986.“The Source of Cobalt in Ancient Egyptian Pigments.” In Proceedings of the 24th International Archaeometry Symposium, ed. J. S. Olin and M. J. Blackman, 369–376. Washington, DC: Smithsonian Institution Press.; Shortland, A. J., M. Tite, and I. Ewart. 2006. “Ancient Exploitation and Use of Cobalt Alums from the Western Oases of Egypt.” Archaeometry 48: 153–168.; Shortland, A. J., and M. S. Tite. 2000. “Raw Materials of Glass from Amarna and Implications for the Origins of Egyptian Glass.” Archaeometry 42: 141–151.; Rehren, T. 2001. “Aspects of the Production of Cobalt-Blue Glass in Egypt.” Archaeometry 43: 483–489.; Tite, M. S., and A. J. Shortland. 2003. “Production Technology for Copper- and Cobalt-Blue Vitreous Materials from the New Kingdom Site of Amarna—A Reappraisal.” Archaeometry 45: 285–312.; Walton, M. S., A. Shortland, S. Kirk, and P. Degryse. 2009. “Evidence for the Trade of Mesopotamian and Egyptian Glass to Mycenaean Greece.” Journal of Archaeological Science 36, no. 7: 1496–1503.), trianite (2Co2O∙CuO∙6H2O), cobaltite (CoAsS), skutterudite ([Co,Ni,Fe]As3), or absolane (a mixture of MnO and CoOOH) (Nicholson, P. T., and I. Shaw. 2000. Ancient Egyptian Materials and Technology. Cambridge: Cambridge University Press.; Kaczmarczyk, A. 1986.“The Source of Cobalt in Ancient Egyptian Pigments.” In Proceedings of the 24th International Archaeometry Symposium, ed. J. S. Olin and M. J. Blackman, 369–376. Washington, DC: Smithsonian Institution Press.). Cobalt is one of the strongest chromophores: even a minimal amount of cobalt is enough to produce a deep blue glass, so intensely colored it can lose its transparency and appear black. Several cobalt sources were available in antiquity, and the trace elements present in blue glass, such as aluminum, copper, manganese, iron, nickel, zinc, arsenic, antimony, and lead can provide an indication of which source was used, providing information about provenance and trade (Gratuze, B., I. Soulier, J.-N. Barrandon, and D. Roy. 1992. “De l’origine du cobalt dans les verres.” ArchéoSciences. Revue d’Archéométrie 16: 97–108.; Rehren, T. 2001. “Aspects of the Production of Cobalt-Blue Glass in Egypt.” Archaeometry 43: 483–489.; Reade, W., I. C. Freestone, and S. J. Simpson. 2005. “Innovation or Continuity? Early First Millennium BCE Glass in the Near East: The Cobalt Blue Glasses from Assyrian Nimrud.” In Annales du 16e Congrès de l’Association Internationale pour l’Histoire du Verre, London, 7–13 September 2003, 23–27. Nottingham: AIHV.; Shortland, A. J., M. Tite, and I. Ewart. 2006. “Ancient Exploitation and Use of Cobalt Alums from the Western Oases of Egypt.” Archaeometry 48: 153–168.).
Blue glass could also be achieved by adding copper to the glass melt, resulting in glass with a blue-green hue. Copper was commonly added in the form of bronze or brass scraps from metalworking, which introduced additional trace elements, such as zinc, tin, and lead (Aerts, A., K. Janssens, F. Adams, and H. Wouters. 1999. “Trace-Level Microanalysis of Roman Glass from Khirbet Qumran, Israel.” Journal of Archaeological Science 26: 883–891.; Mirti, P., P. Davit, M. Gulmini, and L. Saguì. 2001. “Glass Fragments from the Crypta Balbi in Rome: The Composition of Eighth-Century Fragments.” Archaeometry 43: 491–502.; Jackson, C., J. Price, and C. Lemke. 2009. “Glass Production in the First Century AD: Insights into Glass Technology.” In Annales du 17e Congrès de l’Association Internationale pour l’Histoire du Verre, Antwerp, 2006, ed. Koen Janssens, 150–156. Brussels: University Press Antwerp.; Nicholson, P. T., and I. Shaw. 2000. Ancient Egyptian Materials and Technology. Cambridge: Cambridge University Press.; Shortland, A. J., and H. Schroeder. 2009. “Analysis of First Millennium BC Glass Vessels and Beads from the Pichvnari Necropolis, Georgia.” Archaeometry 51: 947–965.; Shortland, A. J. 2002. “The Use and Origin of Antimonate Colorants in Early Egyptian Glass.” Archaeometry 44: 517–530.). Similar to cobalt glasses, the analysis of the trace elements present in copper-based glass can provide information about provenance and workshop practice. It is not uncommon for both cobalt and copper to be detected in ancient blue glass. Whether this mixing was intentional, suggesting the ancient artisans were refining the final blue color by exploiting the slight differences in color produced by copper and cobalt, or, conversely, whether this simply suggests the artisans were using the two chromophores indiscriminately on the basis of material availability, would require further investigation on a wider range of blue glasses.
Turquoise glass is opaque white glass mixed with a small amount of blue glass. The major colorant elements could be antimony and cobalt, antimony and copper, or antimony with cobalt and copper, depending on the type of blue glass used. The color of turquoise glass could further be modified by the addition of opaque yellow glass, colored by lead antimonate, to produce greener hues (Shortland, A. J. 2002. “The Use and Origin of Antimonate Colorants in Early Egyptian Glass.” Archaeometry 44: 517–530.; Nicholson, P. T., and I. Shaw. 2000. Ancient Egyptian Materials and Technology. Cambridge: Cambridge University Press.; Shortland, A. J., and H. Schroeder. 2009. “Analysis of First Millennium BC Glass Vessels and Beads from the Pichvnari Necropolis, Georgia.” Archaeometry 51: 947–965.; Shortland, A. J. 2002. “The Use and Origin of Antimonate Colorants in Early Egyptian Glass.” Archaeometry 44: 517–530.).
Results from the Getty Study Set
The XRF spectra collected on the vessels in the Getty study set provide information on many of the elements present in the glass, but as mentioned above, due to inherent limitations of the method, major elements in the base glass—namely, silicon, potassium, and sodium—cannot be efficiently detected. However, the main colorant and opacifying elements, as well as trace elements that may be associated with different mineral sources, can easily be detected. To ascertain similarities and differences between vessels, Principal Component Analysis (PCA) was used, in which the entire suite of elements detected, and their relative proportions, is examined simultaneously.3 PCA provides a way of visualizing the results of the XRF analyses in more accessible two- or three-dimensional plots; vessels and colors that are close to each other in the plots have similar compositions.
Figure 23 is a three-dimensional PCA plot in which each point represents an individual measurement of the color of glass found on each vessel.4 For example, for vessel cat. 42, the blue, white, and yellow colors were analyzed separately, and appear as distinct points on this plot, colored blue, turquoise, and yellow, respectively, with a red outline. For simplicity, only data from the most abundant colors in the sample set—yellow, white, blue, and turquoise—are shown here. The yellow points, corresponding to yellow glass, form a tight grouping, indicating they all have a similar composition. Their position along PC 1 (see note 4) indicates they are high in lead, consistent with what would be expected for a glass colored with lead antimonate, as described above. The blue, white, and turquoise points form elongated clusters, generally dispersed along PC 1.
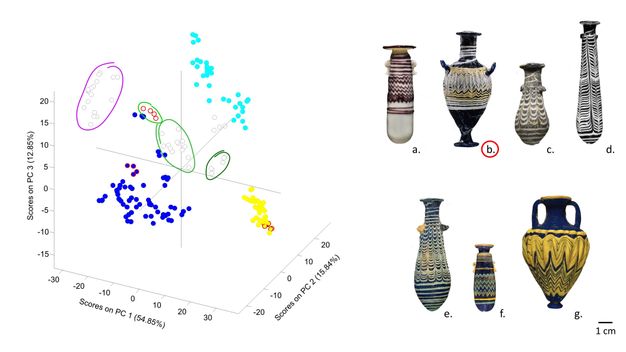
The white points may be subdivided into two groups, white 1 (W1) and white 2 (W2, further subdivided in W2a, W2b and W2c), dispersed along PC 1. Since PC 1 correlates with increasing amounts of lead, it is possible to infer a difference in the chemical composition of the white glasses: W1 includes those whites that contain only antimony, while W2 encompasses those whites that contain antimony associated with increasing amounts of lead. Although already noted in a handful of Iron Age specimens, mostly beads excavated along the Italian peninsula (Arletti, R., A. Ciarallo, S. Quartieri, G. Sabatino, and G. Vezzalini. 2006. “Archaeometric Analyses of Game Counters from Pompeii.” Geological Society, London, Special Publications 257: 175–186.; Arletti, R., C. Maiorano, D. Ferrari, G. Vezzalini, and S. Quartieri. 2010. “The First Archaeometric Data on Polychrome Iron Age Glass from Sites Located in Northern Italy.” Journal of Archaeological Science 37: 703–712.), the presence of lead is quite unusual in opaque white glass. The content of lead observed here, therefore, opens up questions related to its origins. Its presence does not seem to play any role in the development of opacity. It is possible that lead was added to the glass batch to enhance the brilliance of the glass, or to improve the working temperature and viscosity of the melt (Arletti, R., C. Maiorano, D. Ferrari, G. Vezzalini, and S. Quartieri. 2010. “The First Archaeometric Data on Polychrome Iron Age Glass from Sites Located in Northern Italy.” Journal of Archaeological Science 37: 703–712.), but more research is needed to more fully understand how and why it was used.
This variation in lead content does appear to correlate with the chronological attribution of each vessel. Examples dated to the sixth and fifth centuries BCE all fall in W1. Showing a typical calcium- and antimony-rich white glass composition, their production often is believed to have originated on the island of Rhodes, based on the elevated number of examples excavated there. Vessels from the fourth to first centuries BCE instead belong to W2. Here, the presence of lead in addition to the traditional calcium antimonate opacifier suggests a change in the glassmaking practice. The limited examples of lead-containing opaque white glasses discussed in literature makes it hard to draw conclusions, but we can speculate the presence of lead could be indicative of production on the Italian peninsula, in contrast to the lead-free glass produced on the island of Rhodes. Additional analysis and a larger dataset with secure provenance and dating information will be needed to further address this hypothesis.
As discussed above, turquoise glass is essentially opaque white glass with added copper to impart a blue color (Nicholson, P. T., and I. Shaw. 2000. Ancient Egyptian Materials and Technology. Cambridge: Cambridge University Press.; Shortland, A. J., and H. Schroeder. 2009. “Analysis of First Millennium BC Glass Vessels and Beads from the Pichvnari Necropolis, Georgia.” Archaeometry 51: 947–965.; Shortland, A. J. 2002. “The Use and Origin of Antimonate Colorants in Early Egyptian Glass.” Archaeometry 44: 517–530.). This is borne out in the three-dimensional scores plot shown in Figure 23, in which the turquoise points mirror the white points, but displaced along PC 2, corresponding to increased copper content. Vessels dated to the sixth–fifth centuries BCE present a typical calcium-, antimony-, and copper-rich composition, consistent with the glassmaking technology discussed above, that is, the mixing of an opaque white glass rich in calcium antimonate (subgroup W1) with a blue glass rich in copper. Vessels from the later periods show increasing amounts of lead, corresponding to the white subgroup W2. Once again, the reason for the presence of lead is unclear. In the case of turquoise glass, lead could have been introduced through the addition of lead antimonate (opaque yellow) to impart a specific shade to the glass (Panighello, S., E. F. Orsega, J. T. Van Elteren, and V. S. Šelih. 2012. “Analysis of Polychrome Iron Age Glass Vessels from Mediterranean I, II, and III Groups by LA-ICP-MS.” Journal of Archaeological Science 39: 2945–2955.) but could also have been added for the same workability reasons speculated for the opaque white glass.
The data points from the blue glass are widely dispersed across the lower left quadrant in the three-dimensional plot (low in PC 1 and PC 3, suggesting the relative absence of lead and antimony and presence of cobalt and iron, and dispersed along PC 2, correlating to copper content) but do not appear to form clusters. One reason for this may be that the amount of cobalt and copper used to create the blue color is very small, and there are insignificant differences between vessels. Trace elements, which may be more important for the separation of the data points, are below the detection limits of the XRF technique employed here, and thus likewise do not contribute to the separation of the points into groups.
Understanding these results is further complicated by yet another variable: recycling. Similar to today, the practice of remelting glass was already widespread in the ancient world (Triantafyllidis, Pavlos. 2001. “Classical and Hellenistic Glass Workshops from Rhodes.” In Échanges et commerce du verre dans le monde antique. Actes du colloque de l’Association Française pour l’Archéologie du Verre, Aix-en-Provence et Marseille, 2001, 7–9.), reaching its peak during the Roman period (Jackson, C., and S. Paynter. 2021. “Friends, Romans, Puntymen, Lend Me Your Irons: The Secondary Glass Industry in Roman Britain.” In Römische Glasöfen: Befunde, Funde und Rekonstruktionen in Synthese, ed. C. Höpken, B. Birkenhagen, and M. Brüggler, 252–277. Denkmalpflege im Saarland 11. Schiffweiler: Landesdenkmalamt Saarland.). Recycling glass is energy efficient because previously formed glass melts at lower temperatures than those required for the production of glass from raw materials (Chinni, T., A. Silvestri, S. Fiorentino, and M. Vandini. 2023. “Once upon a Glass: Cycles, Recycles, and Reuses of a Never-Ending Material.” Heritage 6: 662–671.). However, careful separation of glass by color is necessary to retain the fidelity of the color. For example, only colorless glass can be used to create new colorless glass, yellow to create new yellow glass, etc. Particular care had to be taken with deep colors: the accidental addition, for example, of blue glass into a melt meant to become colorless glass would require the introduction of significant amounts of decolorant to buffer the tinting of the reused material.
While careful separation of color is possible for monochrome glass, for polychrome glass, including vessels with multiple colors such as the core-formed vessels discussed here, the separation of colors is impossible. Nonetheless, polychrome glass was subject to recycling. When the recycled polychrome object was dominated by a very strong stable color, such as a dark cobalt blue vessel with decorations in white, turquoise, and yellow, the object could be remelted in its entirety and reused to create a dark blue glass. This was recently demonstrated experimentally by Jackson and Paynter (Jackson, C., and S. Paynter. 2022. “Baubles, Bangles, and Beads: Recycling Coloured Glasses in the British Iron Age and Roman Periods.” Archaeometry 64: 150–167.), who created and remelted a modern replica of a dark blue core-formed vessel, colored by cobalt and copper, with decorative trails in yellow (lead antimonate) and turquoise (calcium antimonate and copper). The remelted glass produced a dark blue, transparent glass, in which the decorative yellow and turquoise glass had little effect on the overall color. The composition of the recycled glass showed only a slight increase in lead compared to the original blue. Therefore, for the ancient blue glass discussed in this study, a certain degree of recycling is highly probable, especially for those examples higher along PC 1. Furthermore, in contrast with the white and turquoise glasses, no evident relationship with the attributed chronology could be found from these data, supporting the idea that recycling and reusing broken glass to produce brand-new objects was a common practice.
Conclusions
The long history of the production of ancient glass, with multiple centers of production, evolving technologies, diverse material source locations, and recycling of materials, means that the vessels that have come down to us through the ages may not be easily classified according to their composition. One purpose of this essay was to demonstrate the utility of a completely noninvasive approach for the analysis of glass vessels, using the set of Getty vessels as a case study. The use of X-ray fluorescence (XRF) spectroscopy eliminates the need for sampling, allowing the number of vessels examined to be greatly expanded, in particular to those vessels in museum collections. With compositional data on more vessels, together with archaeological dates and locations, it will be easier to identify groupings that are characteristic of a particular time, place, or even workshop. The use of statistical Principal Component Analysis (PCA) provides a rapid means of grouping vessels that have similar overall compositions and identifying the significant elements in those groups. Even if groups are not evident, that in and of itself is helpful information. It may mean that a different approach is necessary.
As has been demonstrated by studies on samples from archaeological glass fragments, quantification of the amounts of trace elements can help in the classification of ancient glass (Freestone, I. C. 2006. “Glass Production in Late Antiquity and the Early Islamic Period: A Geochemical Perspective.” Geological Society, London, Special Publications 257: 201–216.; Freestone, I. C., M. Ponting, and M. J. Hughes. 2002. “The Origins of Byzantine Glass from Maroni Petrera, Cyprus.” Archaeometry 44: 257–272.; Aerts, A., B. Velde, K. Janssens, and W. Dijkman. 2003. “Change in Silica Sources in Roman and Post-Roman Glass.” Spectrochimica Acta Part B: Atomic Spectroscopy 58: 659–667.; Shortland, A., N. Rogers, and K. Eremin. 2007. “Trace Element Discriminants between Egyptian and Mesopotamian Late Bronze Age Glasses.” Journal of Archaeological Science 34: 781–789.; Silvestri, A., G. Molin, and G. Salviulo. 2008. “The Colourless Glass of Iulia Felix.” Journal of Archaeological Science 35: 331–341.; Degryse, P., and A. J. Shortland. 2009. “Trace Elements in Provenancing Raw Materials for Roman Glass Production.” Geologica Belgica 12: 134–143.). Therefore, we propose a combined approach: an initial survey of a large number of glass vessels using XRF spectroscopy with PCA statistical analysis to identify clusters. This information can be used to target a limited subset of vessels for further analysis using a technique that can provide more precise data, such as SEM-EDS or ICP-MS (depending on the size of the object and the permission to sample), providing a “ground-truth” on which the rest of the XRF data set can be evaluated.
For the relatively small group of twenty-four core-formed vessels discussed here, in the case of white and turquoise glass XRF/PCA analysis was able to identify groups of vessels produced in different time periods. Why lead is present in the vessels from the later periods remains an open question, given the limited examples discussed in the literature. Data from an expanded group of vessels with known dates and excavation locations would help in understanding the role played by lead in white glass. Additional research is also needed to understand the extent to which recycling occurred, and its role not only in the production of blue glass, as discussed above, but in the entire glassmaking industry. Ideally, given sufficient data, a specific set of characteristics may be identified for glass produced in different parts of the Mediterranean, at different time periods, and by different technologies.
Notes
-
XRF analyses were performed using a Bruker ARTAX spectrometer. A chromium (Cr) anode was selected for the analysis to avoid the rhodium (Rh) L-lines that overlap with low-Z elements. The spectrometer was operated at 50 kV and 600 µA; a 100 µm aluminum (Al) filter and helium (He) purge were used to enhance detection of elements in the low energy region. Spectra were collected in the range 0–40 keV with a measuring time of 240 seconds per spot and a 1.5 µm spot diameter. Each vessel contains two (or more) colors, each of which investigated separately, conducting three replicate measurements per spot, and the respective spectra accumulated in the Bruker ARTAX software. Principal Component Analysis (PCA) was performed on the XRF spectra in the energy range 1.45–27.8 keV, following a preprocessing procedure consisting of a log10 transformation, Standard Normal Variate (SNV) scaling, and Mean Centering. The first three principal components were used to tease apart compositional differences within the dataset. ↩︎
-
For a complete list of the vessels investigated in this study, please refer to Table 1. ↩︎
-
Principal Component Analysis (PCA) is a method in which the dimensionality of datasets is reduced by transforming a large set of variables into a smaller one that still contains most of the information in the large set. Principal Components (PCs) are new variables that are constructed as linear combinations of the initial variables. The loading plot identifies which variables have the largest effect on each component. Loadings can range from −1 to 1: loadings close to −1 or 1 indicate that the variable strongly influences the component, while loadings close to 0 indicate the variable has a weak influence on the component. The scores plot projects the observations, i.e. the objects under study, onto the PCs, allowing for an easy localization of the similarities and differences in the dataset (Holland, S. M. 2008. “Principal Components Analysis (PCA).” Department of Geology, University of Georgia, Athens, GA, 30602, 2501.). ↩︎
-
PC 1, the component that captures the most variation, is dominated by lead (Pb). PC 2 and PC 3 reflect the influence of less abundant elements; PC 2 is driven by an opposition between copper (Cu, positive PC 2) and manganese (Mn, negative PC 2), while PC 3 accounts for the variation in antimony (Sb, positive PC 3) versus manganese, iron, and cobalt (Mn, Fe, Co respectively, negative PC 3). ↩︎