This waste dataset includes information from 35 PST ART projects, with 80% of reporting projects indicating that some form of waste-reduction strategy was implemented for their project. One project was excluded from comparative analysis since it used an alternative reporting that focused on a limited number of major fabricated works instead of the exhibition as a whole.
1
Material Sources & Destinations
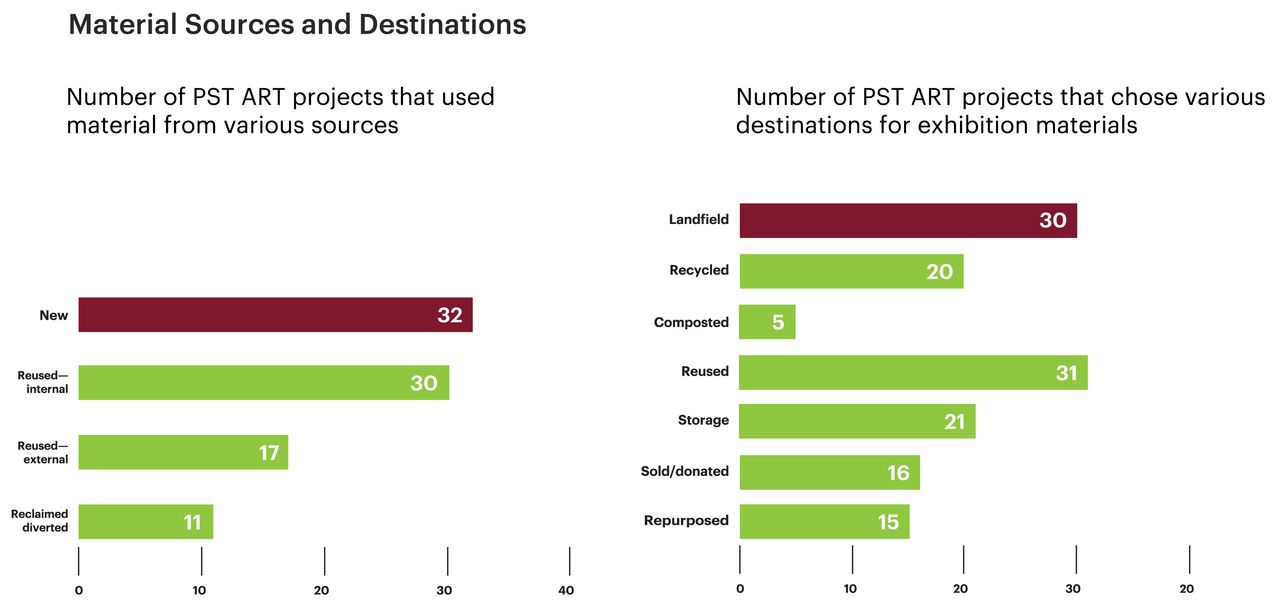
Over 90% of projects sourced new material for their PST show, and 86% of projects sent material to landfill. However, reuse of material from already existing inventory and keeping material afterwards for future reuse was common. No projects reported a “zero-waste” exhibition, but five of the thirty-five projects did not report any material going to landfill. Each of those projects selected other waste destinations, including reusing, selling, donating, storing, and/or recycling. This indicates a need for defining clear criteria for a zero-waste exhibition specifically as no material from the listed reporting categories (and/or otherwise bulky waste) going to landfill directly after the project close.
Material Sources & Destinations - Itemized
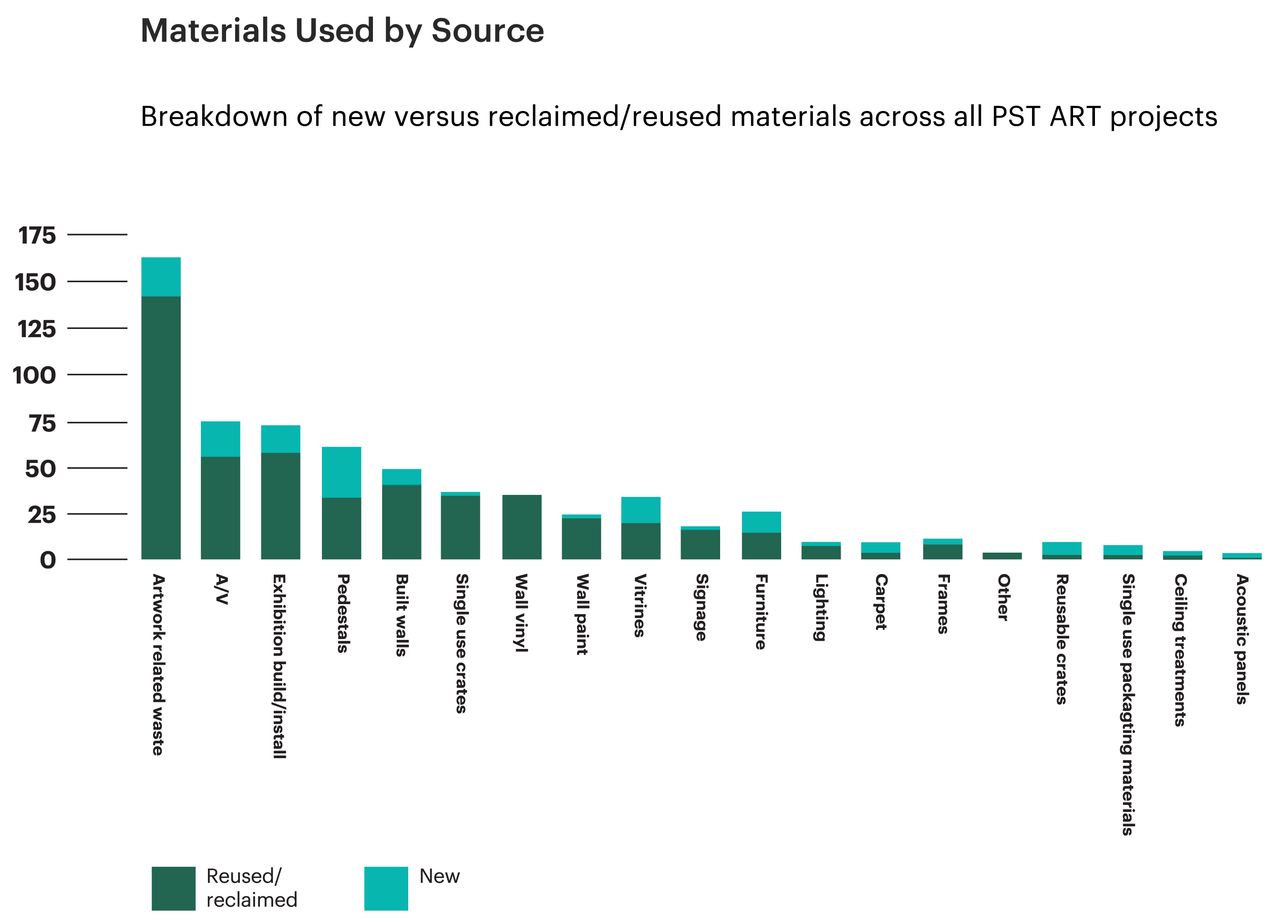
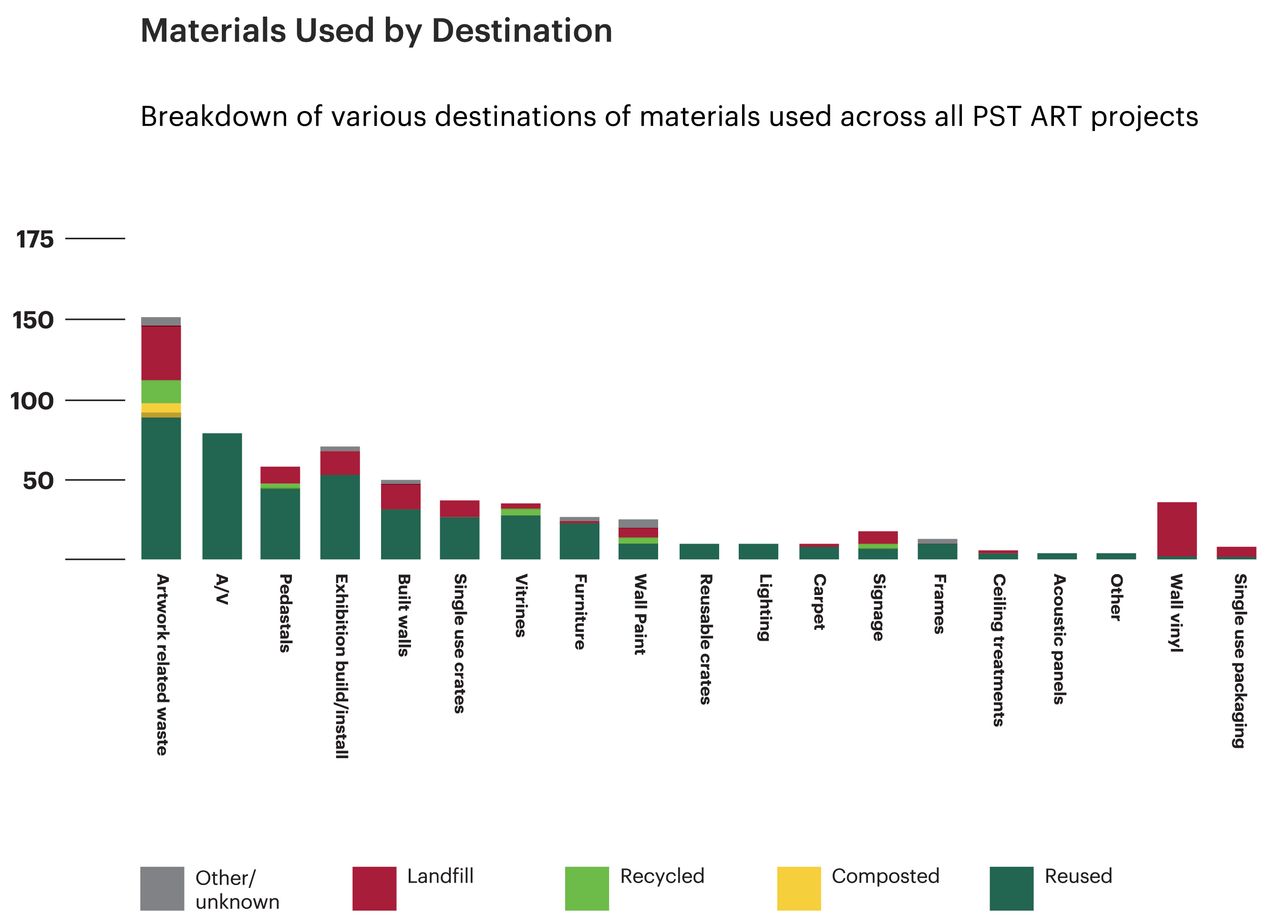
Itemized data was collected on material sourcing and destinations from participating projects. This included reporting for any material that was purchased with exhibition funds and encouraged reporting for other material within set categories of common exhibition material used in the project. The next graphs represent the number of individual line items reported for each category, but not necessarily the bulk of material by quantity or size. These graphs are useful to indicate which material categories were reported, and what was most likely to be sourced as new or reused after use, but they do not represent material quantities.
Most projects sourced new material for their projects, but certain items, including pedestals, vitrines, furniture, and AV, often came from the partner’s existing inventory. Some material was actually reclaimed or diverted from landfill.
While materials like wall vinyl and single-use packaging almost always go to landfill, and artwork related waste can pose a challenge, projects generally found ways to keep, reuse, sell, or donate material after initial use.
2 Pedestals/Vitrines
Information was collected on over 600 pedestals and vitrines used for PST ART projects. In general, most projects reported that at least some of the pedestals and vitrines included in their exhibition were reused, usually from existing inventory. There were two projects that used “reclaimed” pedestals created from material that was diverted from waste, and one project that said they borrowed pedestals from an external source. While many pedestals and vitrines were newly built, a majority were existing.
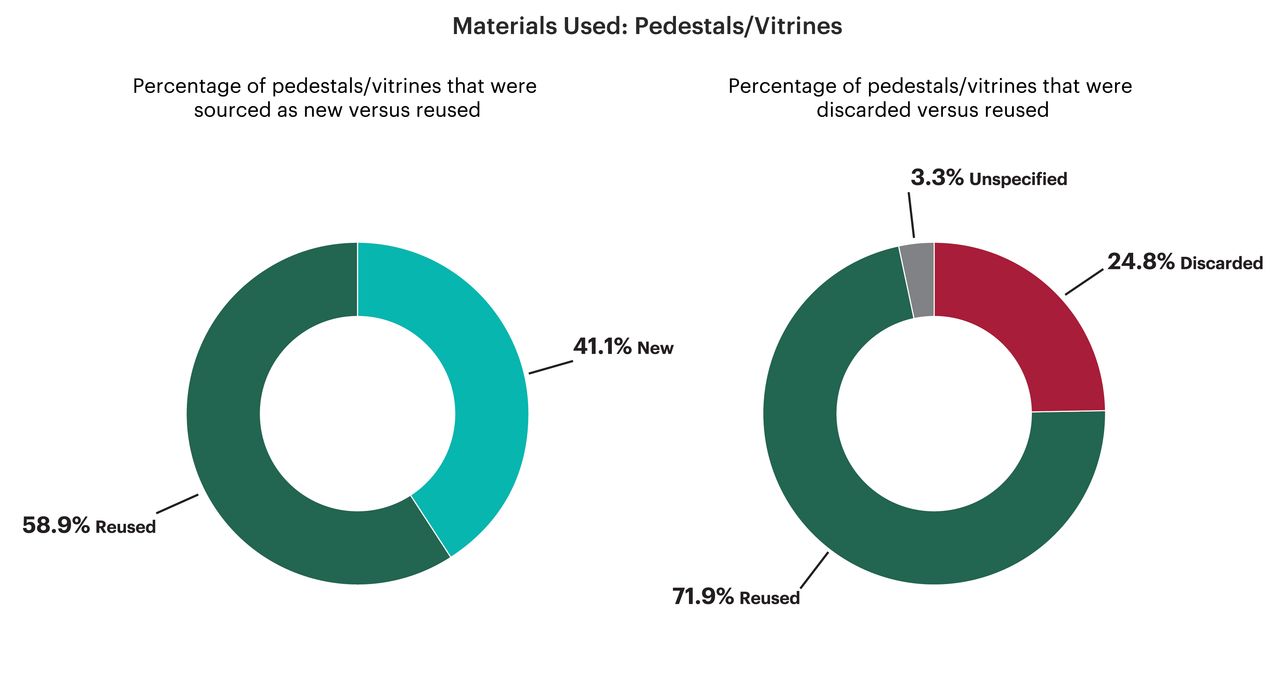
After PST ART, 72% of reported pedestals and vitrines were saved for reuse, primarily by going into storage for future use by the institution. Only a handful of pedestals and vitrines were reported sold or donated, despite being one of the most commonly requested items on the art material exchange platform Barder.
Ninety nine percent (all but one) of reported pedestals and vitrines that went to landfill had been newly fabricated for PST ART.
Only forty percent of newly fabricated pedestals and vitrines were saved for reuse after PST, while 99.7% of reused pedestals and vitrines continued to be reused after the exhibition.
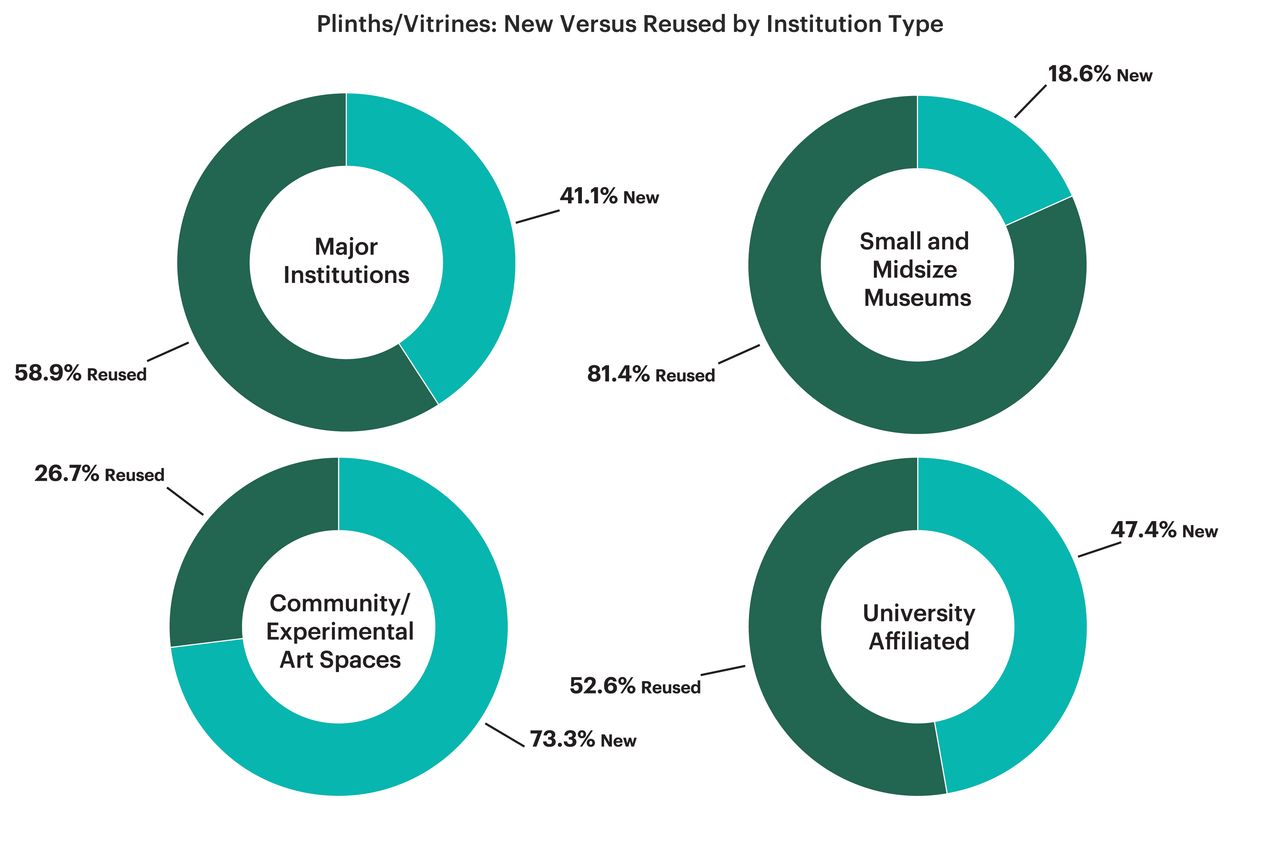
Community and experimental spaces were the most likely to fabricate new pedestals for their PST ART show. This may be because they are less likely to have an existing inventory of pedestals in storage.
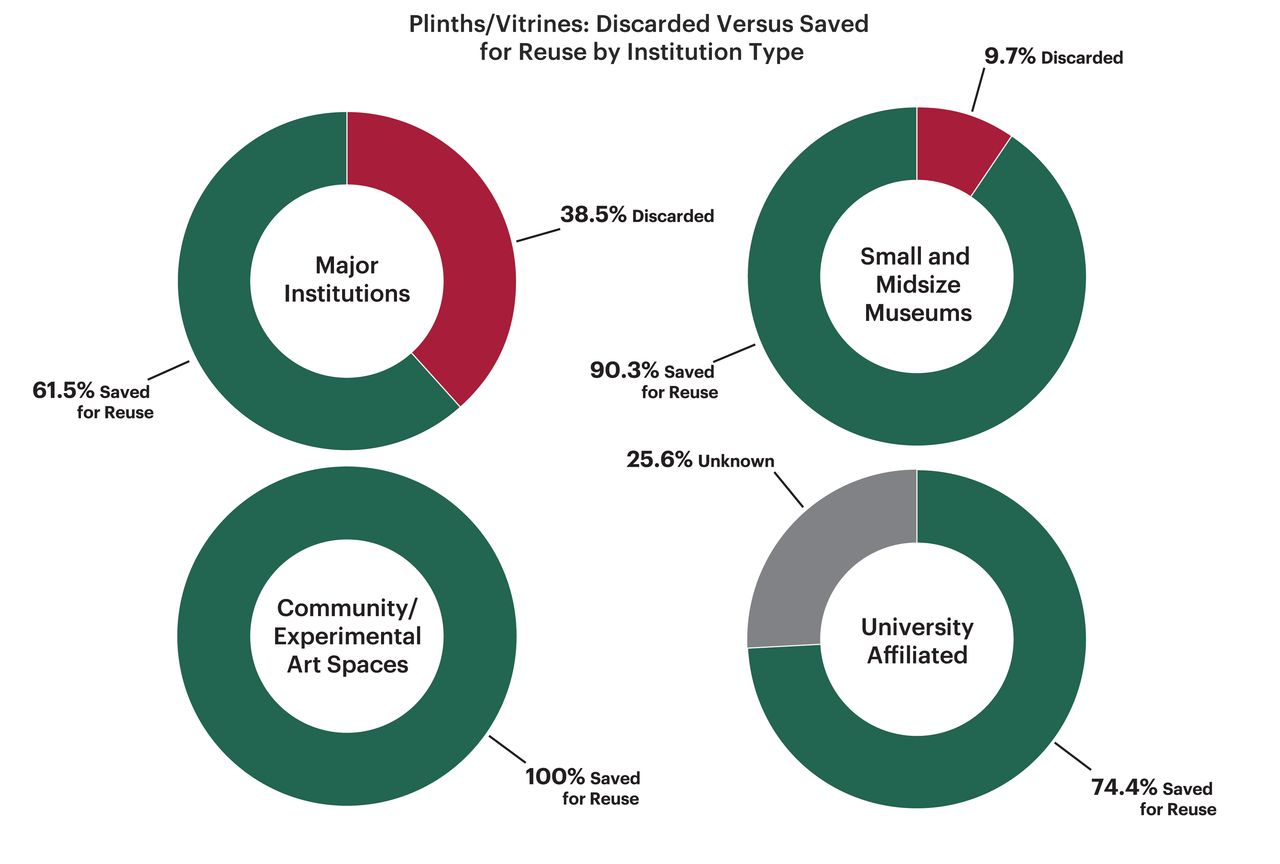
Despite being the most likely to fabricate new pedestals/plinths for PST ART, community and experimental art spaces also reported that all pedestals/plinths were reused after the exhibition, indicating that PST ART funds may help to support some partner venues to add permanent resources to their inventory.
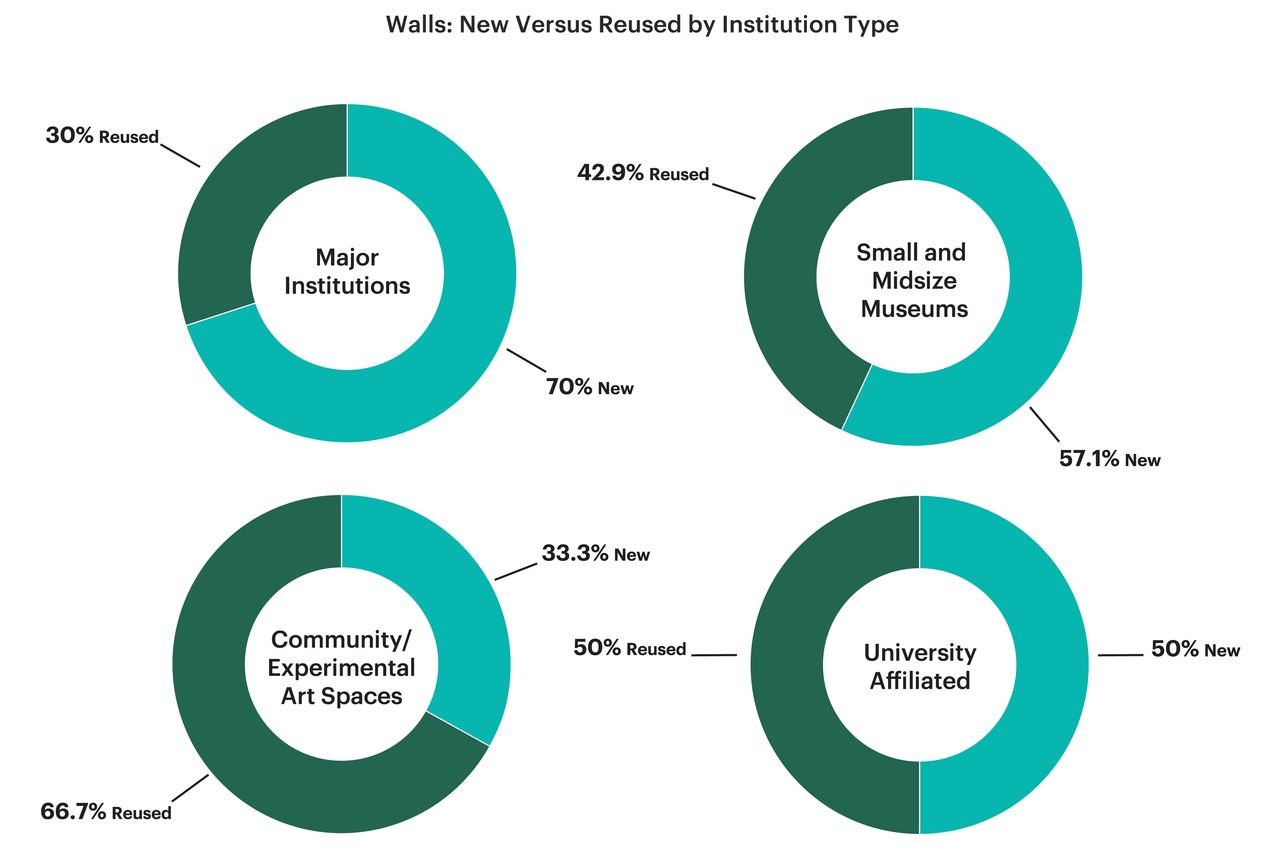
3 Built Walls
Eighteen of thirty-five projects in the dataset reported using built walls for their PST ART project.
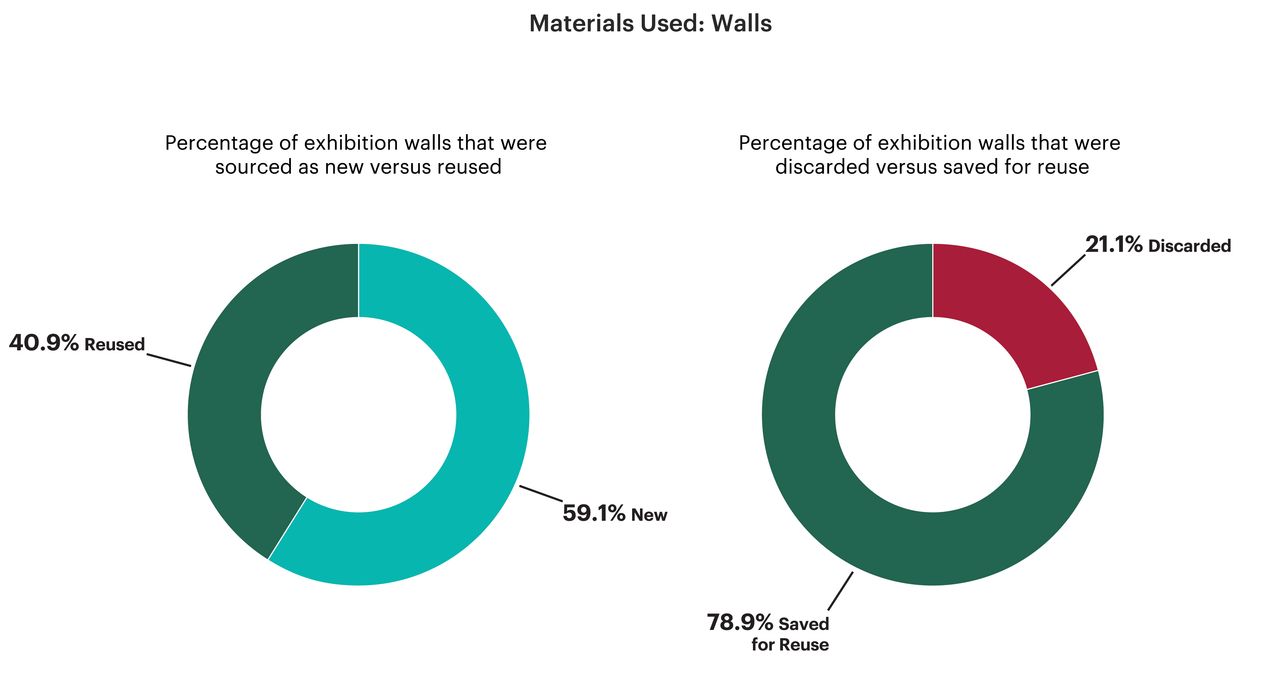
While thirteen of the projects that reported using built walls sourced new walls for their show, all but four projects either used reusable wall systems or planned to continue to use the built wall after the PST ART project. Overall, only five projects that built walls planned to demolish and send them to landfill after the exhibition.
We noted that many of the built walls reported as “new” appeared to be additions to an institution’s existing modular wall system.
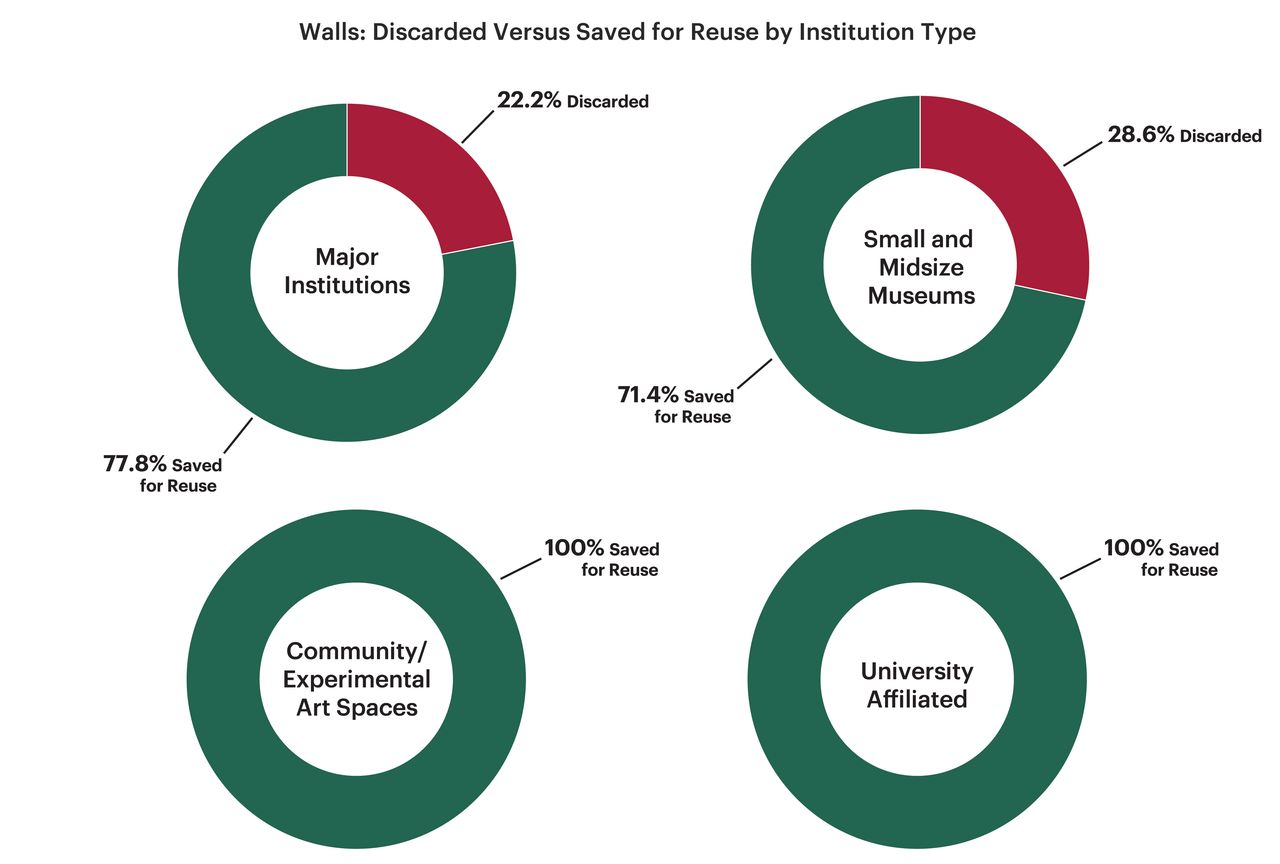
Overall, only four projects indicated sourcing new walls that then went to landfill.
Data Insights:
-
For items such as pedestals and built walls, smaller institutions can use PST ART funds to add important resources to their lasting infrastructure and inventory that will be used well beyond PST.
-
Overall, there were a limited number of built walls and pedestals that were newly fabricated for PST and then sent to landfill afterwards.
4 Wall Vinyl
Half of the reporting PST ART projects indicated using wall vinyl, and this material was often cited in reports as a common pain point that lacks good alternative solutions.
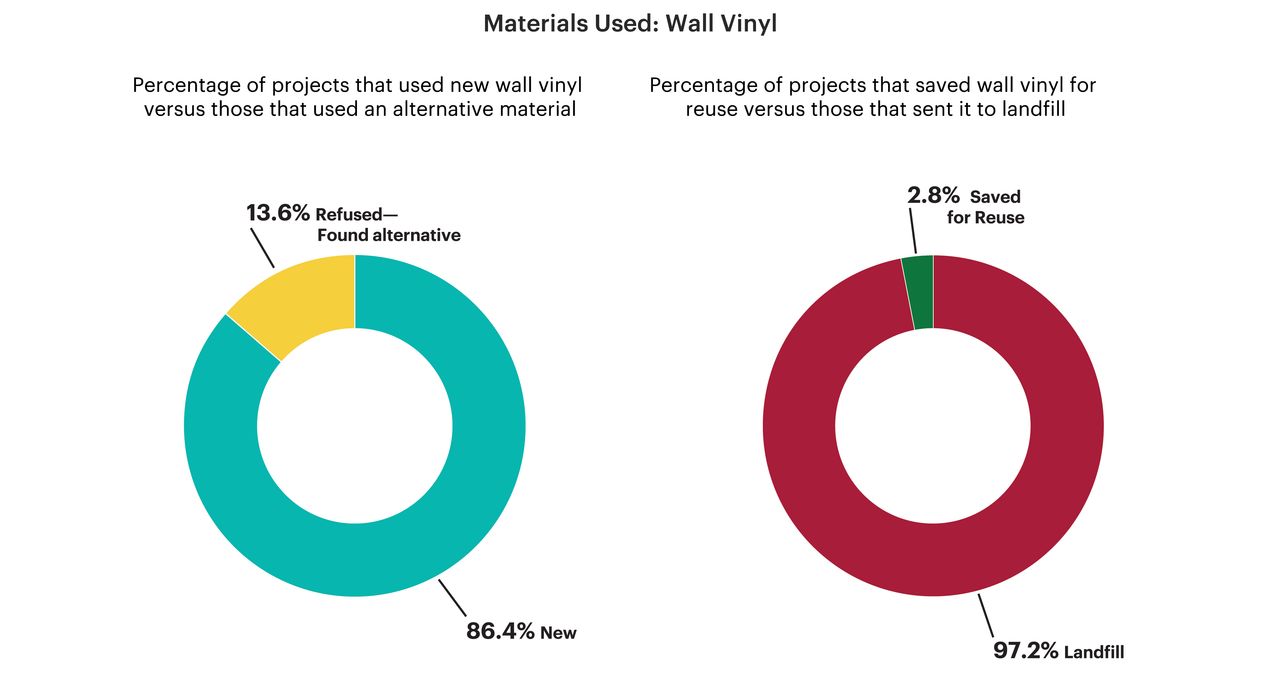
Three projects that would have otherwise used wall vinyl found alternative solutions, indicated here as “Refused - Found Alternative.” And one project reported that their wall vinyl would be able to be reused (see Spotlight: Wall Vinyl Alternatives in Program Outcomes). Otherwise, all wall vinyl was sourced as new and went to landfill after use.