Emissions are listed in tCO2e, which stands for tonnes of carbon dioxide equivalent. “Tonne” is another way of writing metric ton, or 2,200 pounds. “Carbon dioxide equivalent” is a standard unit for counting greenhouse gas (GHG) emissions regardless of whether they’re from carbon dioxide or another gas, such as methane. This is the unit generated by the GCC Carbon Calculator, the preferred tool used by project teams to calculate their emissions. For data that is broken down by institution type, we used the following categories: Major Institutions; Small-Midsize Institutions; Community/Experimental Spaces; and University Affiliated. Please see the “Participant List” appendix for a list of participating organizations in each category.
The Total Reported Emissions section (1) includes data from all 36 reporting projects. The dataset for the remaining sections (2 through 5) excludes the two projects that reported the highest and lowest emissions for Major Institutions. These outliers were removed to avoid skewing data averages in the comparative emission analysis graphs and intensity metric calculations.
1 Total Reported Emissions
Projects reported over 2,167 tCO2e emitted for PST ART exhibitions. This amount of carbon dioxide would:
-
Fill the LA Coliseum Stadium playing field with carbon dioxide gas more than two and a half times over.1
-
Power the electricity of 452 US homes over one year.2
Burn twelve railcars worth of coal.
-
Require 2,174 acres of US forest to sequester back into the ground, about the size of one half of Griffith Park.3
This is not the total carbon footprint of PST ART, but the total calculated emissions by reporting participants. Since emissions data categories were limited and data was reported for half of all PST ART exhibitions, it is not unreasonable to assume that the equivalencies above might be doubled for the initiative as a whole.
|
Source |
Emissions |
Operational Unit* |
|---|---|---|
|
International Flights |
886.4 tCO2e |
428 trips |
|
Domestic Flights |
160.4 tCO2e |
374 trips |
|
All Flights |
1046.85 tCO2e |
802 trips |
- * Trip refers to one way travel leg
Source |
Emissions |
Operational Unit |
|---|---|---|
Air Freight |
458.6 tCO2e |
38 tons |
Long-Haul Road Freight |
64.2 tCO2e |
160 tons |
Sea Freight |
6.8 tCO2e |
29 tons |
Local Freight (itemized)* |
2.8 tCO2e |
47+ tons |
Local Freight (not itemized)† |
1.1 tCO2e |
Unknown |
All Freight |
558.9 tCO2e |
274 tons |
- * Optional reporting category
- † Optional reporting category. Emission calculations reported by projects but not verified by LHL Consulting
2
Emissions Sources Breakdown
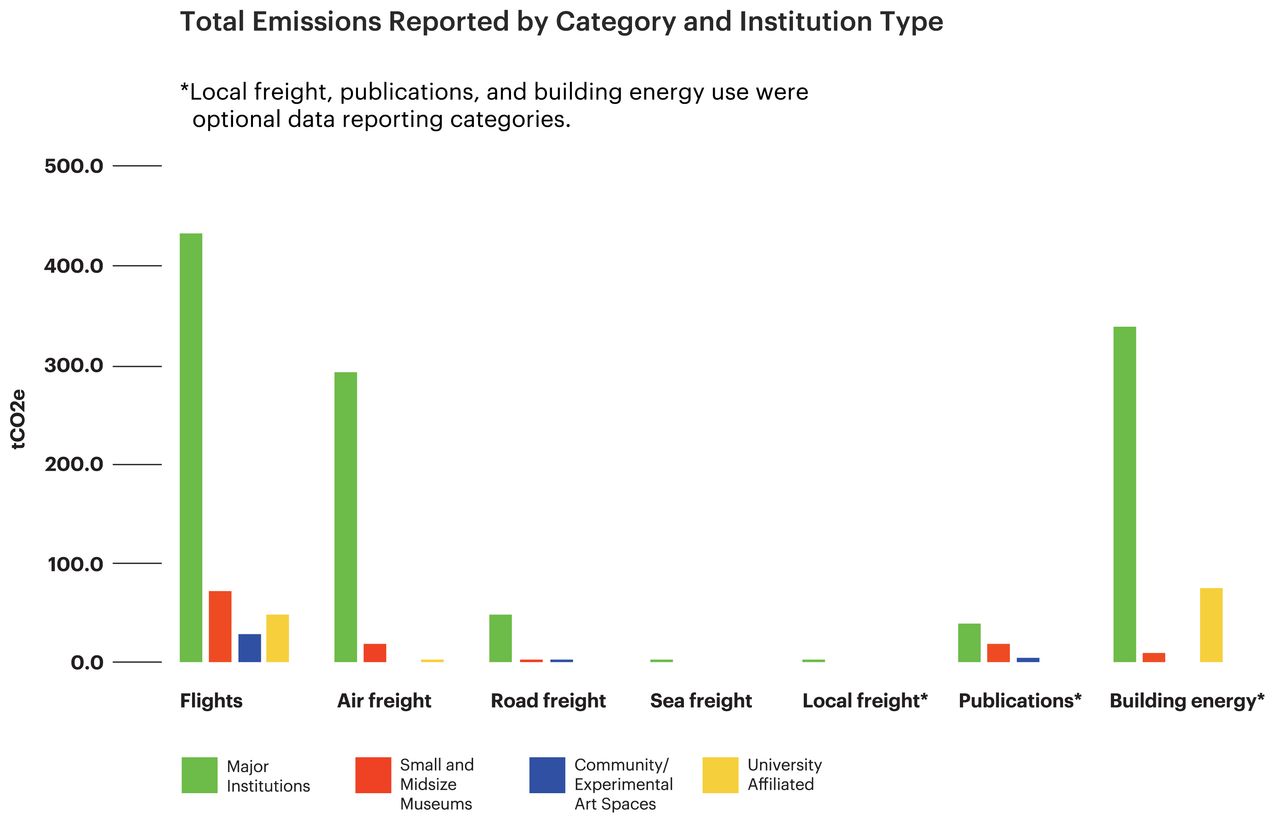
When we look at data grouped by emission type, major institutions reported the highest emissions levels in all categories. Among the required reporting categories, flights were almost always the highest sources of emissions for projects that required air travel, followed by air freight. Building energy use was an optional category, since this data was often inaccessible to PST ART project teams.
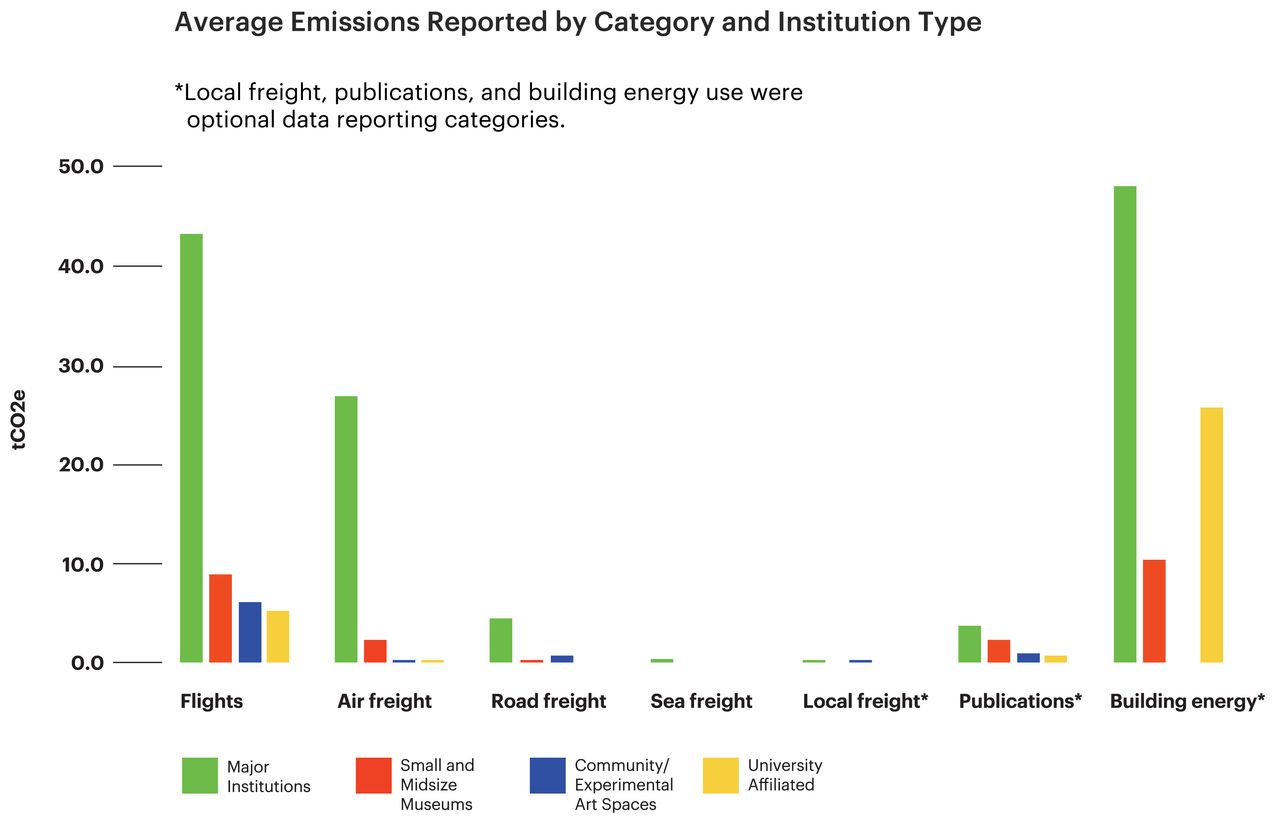
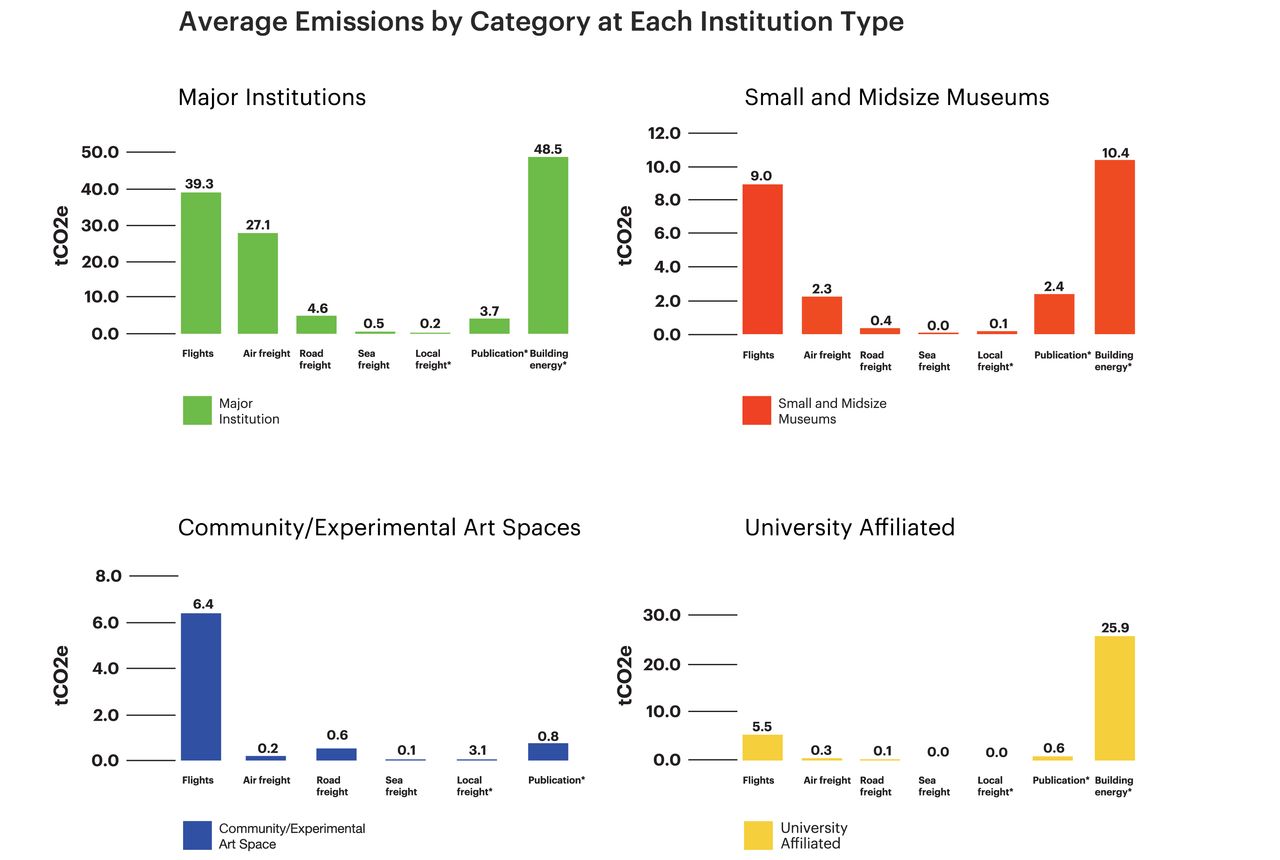
When we look at emissions sources by institutional type, building energy was almost always the highest source of emissions for organizations reporting this category. While specific approaches varied, projects that opted to report on building energy were instructed to approximate the energy use specifically attributed to the PST ART exhibition by using this methodology: [Total kWh from power bills for entire space] x [% of space allocated to exhibition] x [# of days from first day of install to last day of dismantle]. For the emissions categories that were limited to PST ART projects, flights were generally the highest sources of emissions. For non-major institutions, publications were often a comparable source of emissions to their total exhibition freight.
3
Emissions Intensity Metrics
A variety of intensity metrics are provided with the intention of being able to use them to set future reduction targets and allow for comparative metrics with other reporting initiatives/datasets. The table below provides information on the Project Related Carbon (PRC), defined as long haul travel and freight emissions related to the project. The chosen intensity metrics breakdown carbon emissions by exhibition size, implementation grant dollars awarded, and exhibition duration.
|
Institution Type |
Total PRC reported |
Average PRC |
Intensity Metric 1: PRC/SqFt |
Intensity Metric 2: >PRC/$$ |
Intensity Metric 3: PRC/Wk |
|---|---|---|---|---|---|
Major Institutions (11) |
787.20 tCO2e |
71.56 tCO2e |
7.5 tCO2e/sq ft |
2.40 tCO2e/$$ |
2.47 tCO2e/wk |
Small/Midsized (8) |
91.46 tCO2e |
11.43 tCO2e |
1.12 tCO2e/sq ft |
0.56 tCO2e/$$ |
.46 tCO2e/wk |
Community/Experimental (5) |
35.63 >tCO2e |
7.13 tCO2e |
2.1 tCO2e/sq ft |
0.35 tCO2e/$$ |
.31 tCO2e/wk |
University-Affiliated (9) |
53.14 tCO2e |
5.90 tCO2e |
1.89 tCO2e/sq ft |
0.39 tCO2e/$$ |
.27 tCO2e/wk |
|
All Projects (33) |
967.42 tCO2e |
29.32 tCO2e |
4.2 tCO2e/sq ft |
1.32 tCO2e/$$ |
1.28 tCO2e/wk |
- PRC
- Project Related Carbon: long-haul travel and freight emissions (flights, air freight, sea freight, long-haul road freight), measured in tonnes of carbon dioxide equivalent emissions (tCO2e)
- PRC/SqFt
- Average PRC per 1000 square feet of exhibition space
- PRC/$$
- Average PRC per $10,000 of implementation grant dollars
- PRC/Wk
- Average PRC per week the project was open
Travel intensity metrics were calculated based on flight information provided by all reporting organizations. As detailed in the table below, major institutions had the highest number of flights, translating into the highest total emissions and average per flight.
|
Institution Type |
Total Flight Emissions |
Average Flight Emissions |
Number of One Way Flights |
Intensity Metric 1: Emissions/Trips |
|---|---|---|---|---|
Major Institutions |
432.4 tCO2e |
39.3 tCO2e |
389 |
1.11 tCO2e/trip |
Small/Midsized |
72.0 tCO2e |
9.0 tCO2e |
127 |
.57 tCO2e/trip |
Community/Experimental |
32.1 tCO2e |
6.4 tCO2e |
71 |
.45 tCO2e/trip |
University Affiliated |
49.7 tCO2e |
5.5 tCO2e |
64 |
.78 tCO2e/trip |
|
All Projects |
586.2 tCO2e |
17.8 tCO2e |
651 |
.9 tCO2e/trip |
- Emissions/Trips
- Average flight emissions per trip, counted as one way leg
Long Haul Freight (LHF) emissions data was used to establish intensity metrics for shipping. The table below provides information on total and average LHF emissions, with intensity metrics that breakdown shipping emissions by journey and by weight transported. Initially, the intensity metric LHF/Ton was a surprise as it indicated that small and midsized museums had the highest intensity and that university-affiliated projects were only slightly behind major institutions.
|
Institution Type |
Total LHF |
Average LHF |
Intensity Metric 1: LHF/Journey (See Table: # of freight journeys across different types of institutions) |
Intensity Metric 2: LHF/Ton (See Table: Percent of total freight weight by freight type across different types of institutions) |
|---|---|---|---|---|
Major Institutions |
354.79 tCO2e |
32.25 tCO2e |
1.65 tCO2e/Journey |
1.83 tCO2e/Ton |
Small/Midsized |
19.426 tCO2e |
2.43 tCO2e |
.22 tCO2e/Journey |
3.86 tCO2e/Ton |
Community/ Experimental |
3.57 tCO2e |
.71 tCO2e |
.13 tCO2e/Journey |
.26 tCO2e/Ton |
University-Affiliated |
3.41 tCO2e |
.38 tCO2e |
.09 tCO2e/Journey |
1.71 tCO2e/Ton |
|
All Projects |
381.73 tCO2e |
11.57 tCO2e |
1.03 tCO2e/Journey |
1.78 tCO2e/Ton |
- LHF
- Freight emissions due to air freight, sea freight, and long-haul road freight measured in tCO2e, with verified emissions only
- LHF/Journey
- Average LHF emissions per freight shipment journey, counted as one way legs
- LHF/Ton
- Average LHF emissions per ton of weight transported
Additional calculations in the two tables below for weight transported and journeys taken by shipping method and institution type help explain the LHF/Ton intensity metrics. While major institutions had overall higher emissions and higher numbers of total freight journeys, they were also much more likely to transport heavy material by sea freight, resulting in a lower LHF/Ton.
It was surprising to see that university-affiliated projects had the highest percentage of weight transported by sea freight.
|
Institution Type |
Weight Transported Air Freight |
Weight Transported Sea Freight |
Weight Transported Long Haul Road Freight |
Total Weight Transported |
|---|---|---|---|---|
Major Institutions |
27.23 tons |
26.76 tons |
139.72 tons |
193.71 tons |
Small/Midsized |
1.74 tons |
.07 tons |
3.21 tons |
5.03 tons |
Community/Experimental |
.08 tons |
1.12 tons |
12.53 tons |
13.74 tons |
University-Affiliated |
.55 tons |
.41 tons |
1.03 tons |
1.99 tons |
|
All Projects |
29.61 tons |
.28.36 tons |
156.5 tons |
214.47 tons |
|
Institution Type |
Airfreight Journeys* (one-way legs) |
Sea Freight Journeys |
Long Haul Road Freight Journeys |
Total # of Freight Journeys Reported |
|---|---|---|---|---|
Major Institutions |
70 Journeys |
44 Journeys |
101 Journeys |
215 Journeys |
Small/Midsized |
27 Journeys |
1 Journey |
62 Journeys |
90 Journeys |
Community/ Experimental |
7 Journeys |
1 Journey |
19 Journeys |
27 Journeys |
University-Affiliated |
17 Journeys |
2 Journeys |
20 Journeys |
39 Journeys |
|
All Projects |
121 Journeys |
48 Journeys |
202 Journeys |
371 Journeys |
The table below provides information on average shipping emissions based on the method of freight used. While it is already well established that air freight is the most carbon intensive method of shipping artwork, these numbers provide intensity metrics per one way journey and per ton of weight transported, which can be used to help projects perform ballpark estimates of expected carbon output when planning for exhibition shipping.
|
Freight Type |
Total Emissions |
Emissions per Journey (See Table: # of freight journeys across different types of institutions.) |
Emissions per Ton (See Table: Percent of total freight weight by freight type across different types of institutions.) |
|---|---|---|---|
Air Freight |
319.80 tCO2e |
2.64 tCO2e/journey |
10.80 tCO2e/Ton |
Sea Freight |
6.47 tCO2e |
.13 tCO2e/journey |
.23 tCO2e/Ton |
Long-Haul Road Freight |
55.46 tCO2e |
.28 tCO2e/journey |
.35 tCO2e/Ton |
|
All Freight |
381.73 tCO2e |
1.03 tCO2e/journey |
1.78 tCO2e/Ton |
Publication reporting was option, but the majority of projects that produced publications as part of their exhibition (74%) provided emissions data. Some, but not all, projects separately included publication shipping with their freight reporting. The following table shows total emissions and average emissions per publication across all institutions types, calculated using the GCC Carbon Calculator.
|
Institution Type |
Total Publication tCO2e |
Average Publication tCO2e |
|---|---|---|
|
Major Institutions (7 publications reported) |
60.75 tCO2e |
8.68 tCO2e |
Small/Midsized (5) |
19.18 tCO2e |
3.84 tCO2e |
Community/Experimental (4) |
3.9 tCO2e |
.98 tCO2e |
University-Affiliated (4) |
5.2 tCO2e |
1.3 tCO2e |
|
All Projects (20) |
89.03 tCO2e |
4.45 tCO2e |
4 Flight Emissions Breakdown
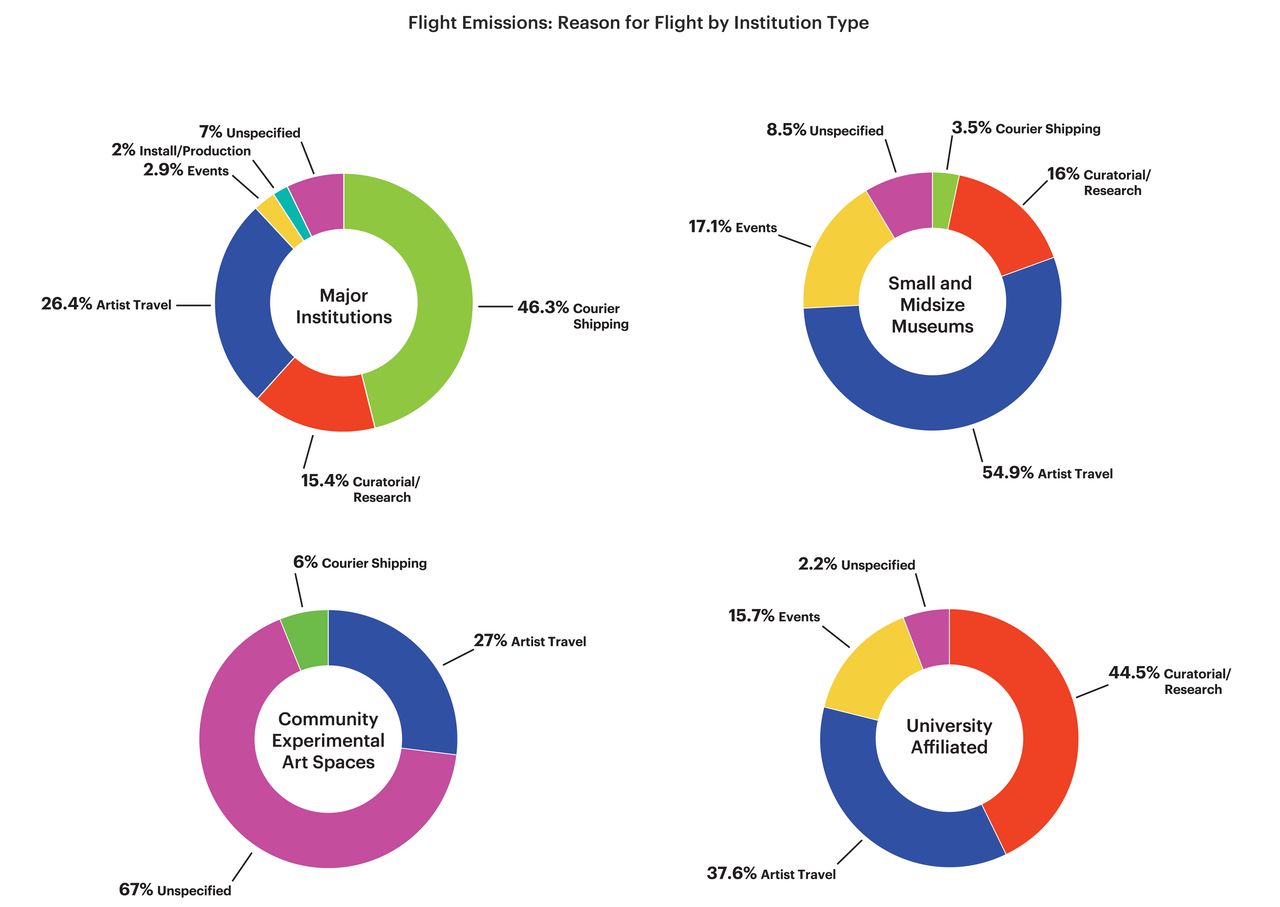
On average across all PST ART projects, courier or shipping-related travel and artist travel were the most common sources of flight emissions, followed by curatorial and research travel.
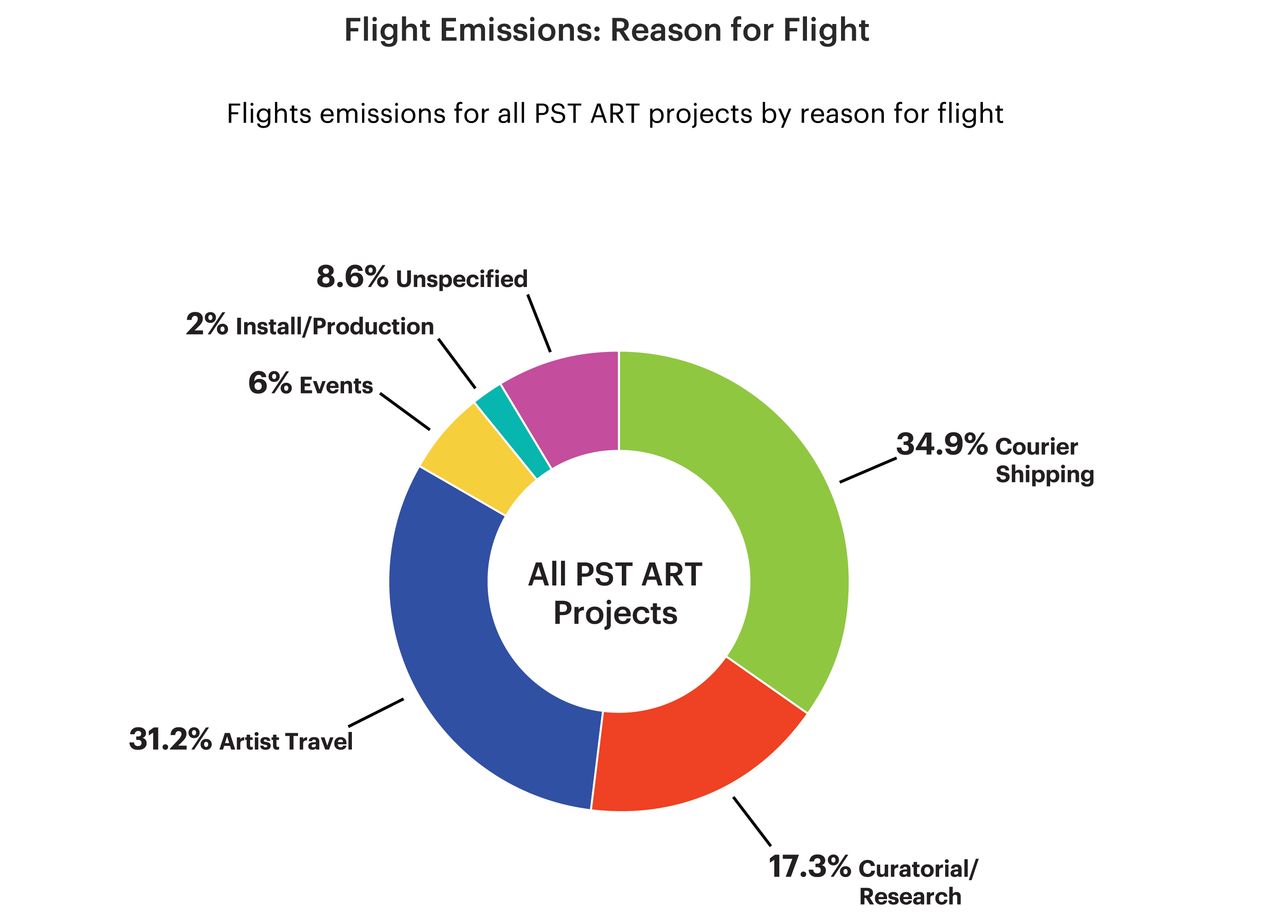
However, the primary reason for flight emissions was significantly different across various institution types. Major institutions were more likely to have courier flight emissions. Small or midsized museums were most likely to have artist flight emissions. University affiliated spaces were most likely to have curatorial and research related flight emissions. Community and experimental spaces were most likely to have provided limited data about the reasons for their flight emissions.
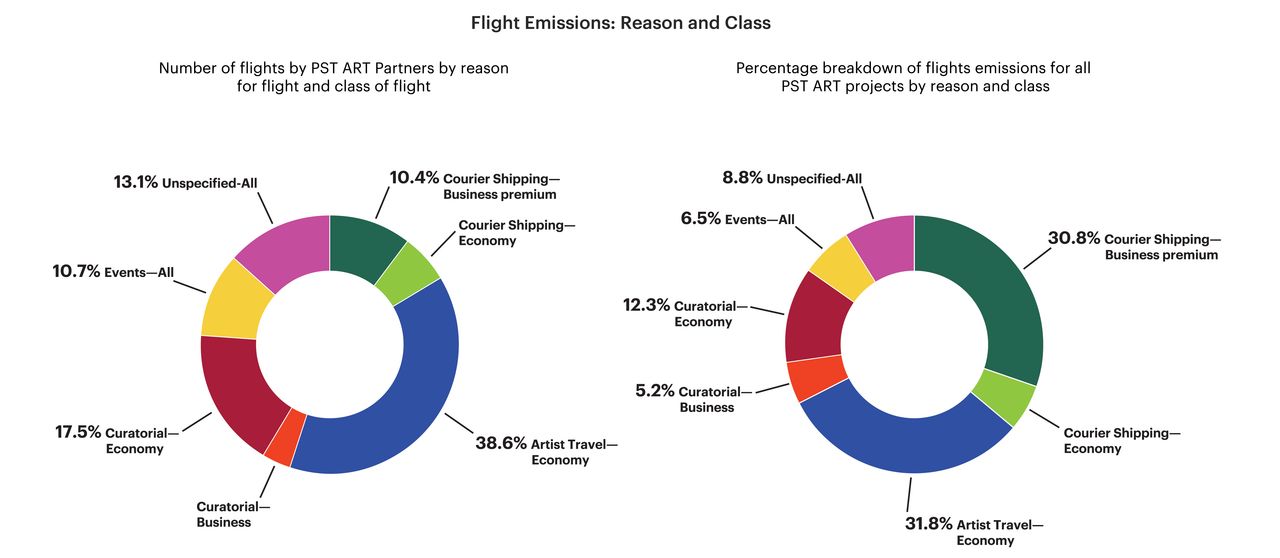
Breaking down flight emissions further by flight class and reason, it was evident that courier flights had an outsized impact on overall flight emissions, accounting for 16% of the flights taken but 35% of the reported flight emissions. This is mostly due to business class courier flights, which accounted for 10% of total flights taken but 30% of the reported flight emissions. Almost all non-economy flights taken for PST ART were for courier travel, as well as a small number of long-haul curatorial research trips.
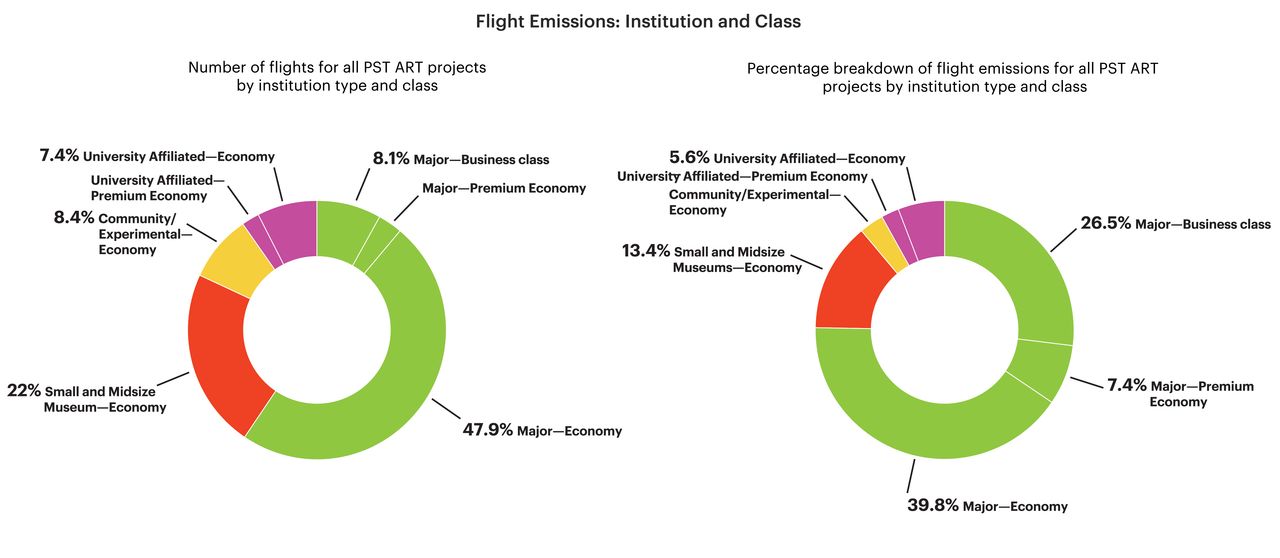
When examining this further by institution type, all business class flights taken for PST ART project were reported by major institutions, and almost all were for courier trips. Business flights accounted for only 8.1% of the total number of flights taken for PST ART but resulted in 26.5% of reported flight emissions.
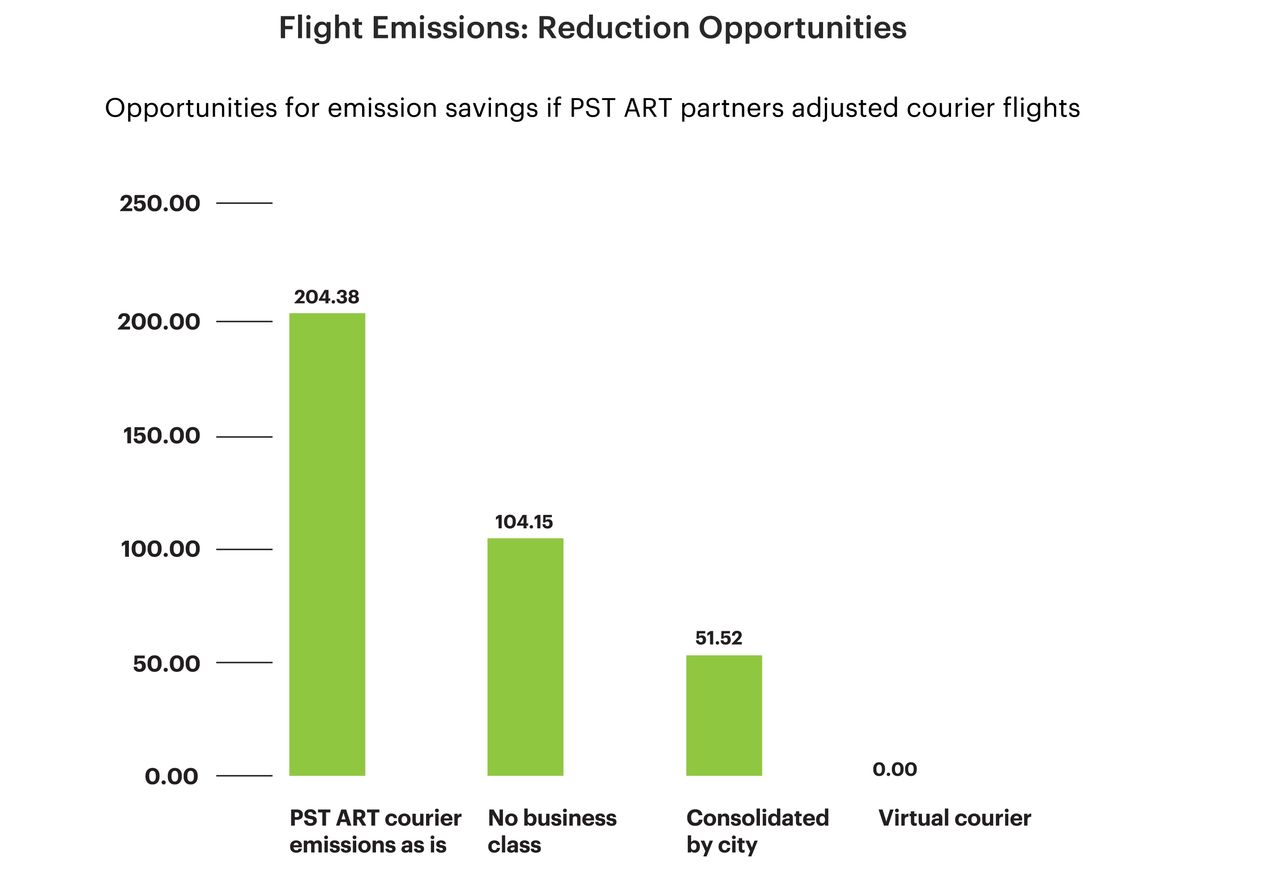
Avoiding business class flights for couriers would have saved half of reported courier emissions. Consolidating all individual courier trips from the same location to a single, shared trip would have saved 75% of courier emissions. Using virtual couriers could reduce courier emissions to zero.
5
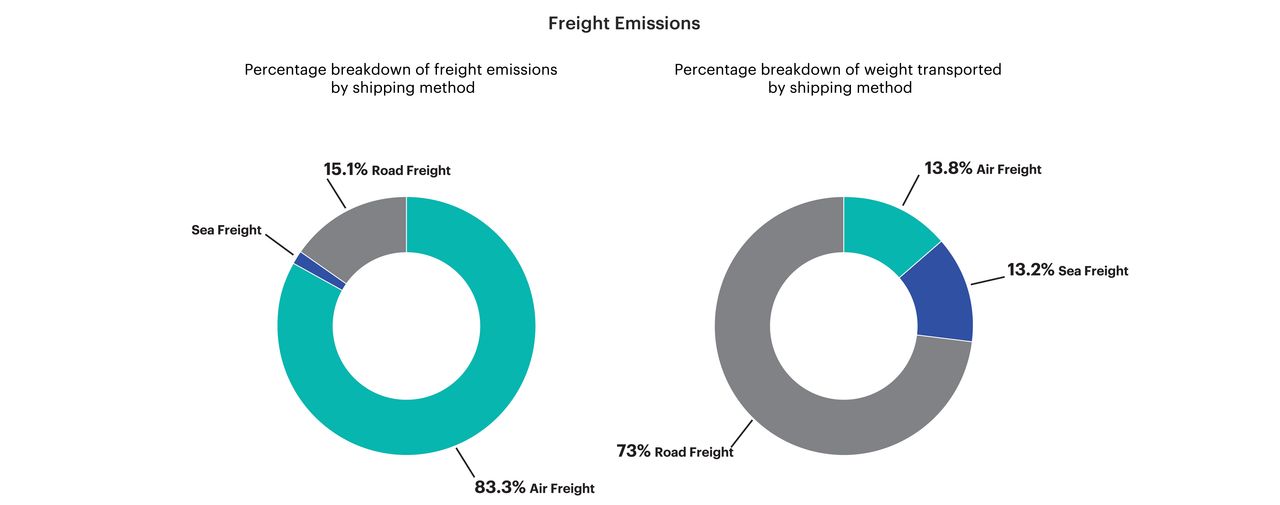
Freight Emissions Breakdown
When it came to freight emissions, shipping by air freight had an outsized impact on emissions. Almost all (86.6%) of freight emissions resulted from air freight, although less than 17% of material by weight was transported by air freight. A majority of air freight shipments (115 out of 157) were for overseas destinations, meaning sea freight was the only possible alternative. For domestic routes, 33 shipments traveled as air freight. Presumably all of these could have travelled via road freight.
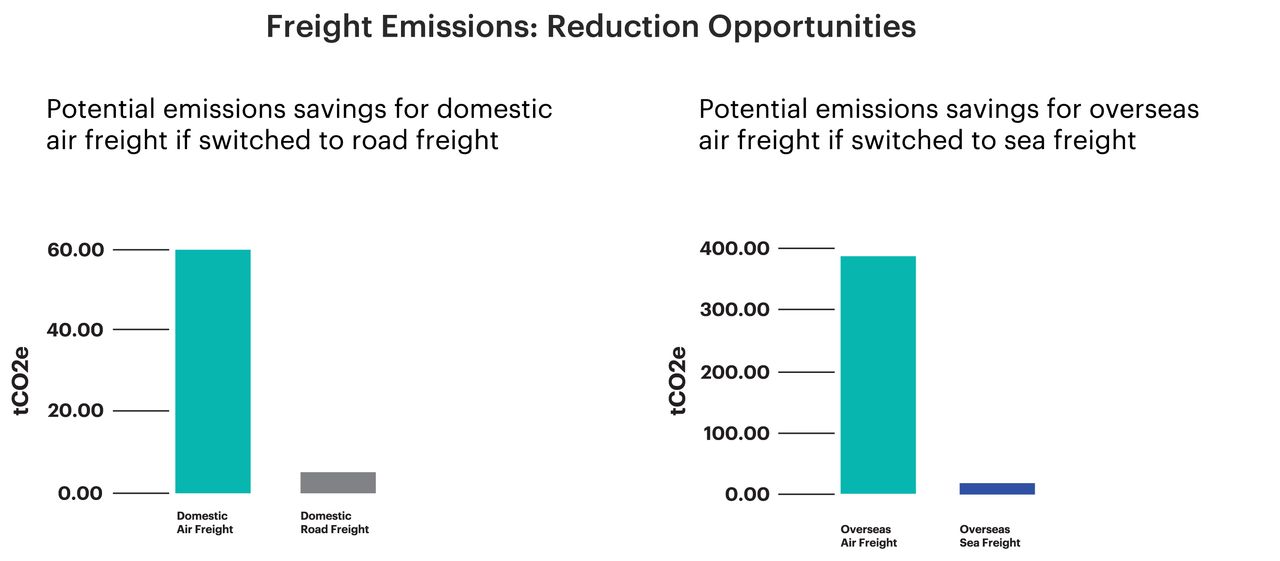
63.55 tCO2e could have been prevented by shipping domestic via road freight. For overseas air freight, 387.98 tCO2e could have been prevented if shipped by sea freight. While sea freight isn’t always a viable option, the drastic reduction in emissions should make it a larger part of the conversation if international shipping is deemed necessary.
Notes
-
Calculation based on an approach by Real World Visuals. At standard pressure and 59 °F a metric ton of carbon dioxide gas would fill a sphere 33 feet across (density of CO₂ = 1.87 kg/m³). Source. LA Coliseum playing field is 135,837 SF / Height of Playing Field to top of stadium is 115’ 8” / Source. Solving for cubic volume of the LA Coliseum playing field to the top of the stadium is ~15.8M cubic feet. Solving for cubic volume of a tCO2e would be approximately 18,816 cubic feet per tCO2e. 2167 tCO2e x 18816 cubic feet = 40.7M cubic feet of tCO2e. 40.7/15.8 = 2.6 x. ↩︎
-
Emission equivalencies from: “Greenhouse Gas Equivalencies Calculator,” Environmental Protection Agency, November 2024, ↩︎
-
Griffith Park is 4210 acres. Source: https://griffithobservatory.org/. ↩︎