When Allan Kaprow was commissioned to compose and present a happening at a university, as he often was in the mid- to late 1960s, he would typically start by researching and selecting one or two settings. To this end, for Soap, Kaprow consulted this chart, which shows the average times and heights for the highs and lows of the waves at Sarasota Bay in February. Viewed through the lens of the avant-garde, the chart looks like a readymade graphic score, and this is far from incidental in a practice like Kaprow’s, which tends to model his artistic forms on vernacular references.
More ...
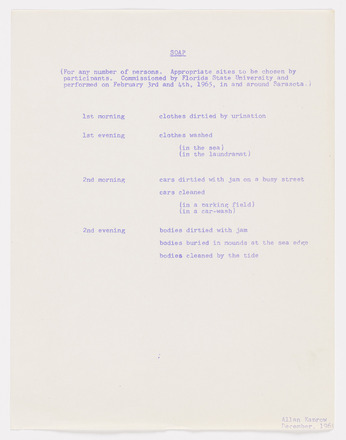
Three differently formatted scores for
Soap (December 1964)
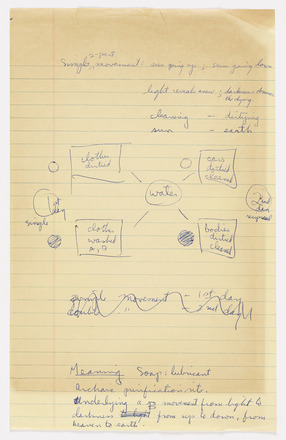
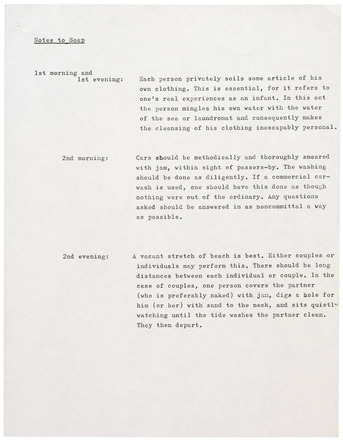
Handwritten page of notes for
Soap (fall 1965)
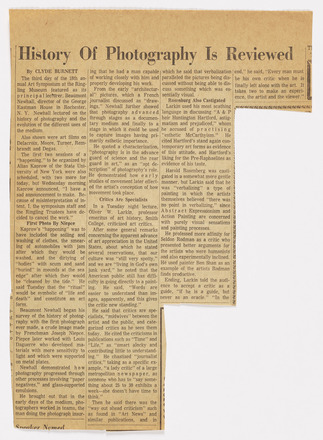
Allan Kaprow’s clipping of Clyde Burnett,
“History of Photography Is Reviewed,” likely
printed in the
Sarasota Herald-Tribune (1965)
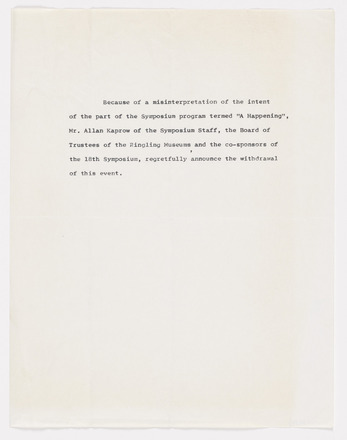
Notice of cancelation of Allan Kaprow’s
Soap (1965)
Letter from Robert Carter, a graduate student in
painting at Florida State University, to Allan
Kaprow (ca. 1965)
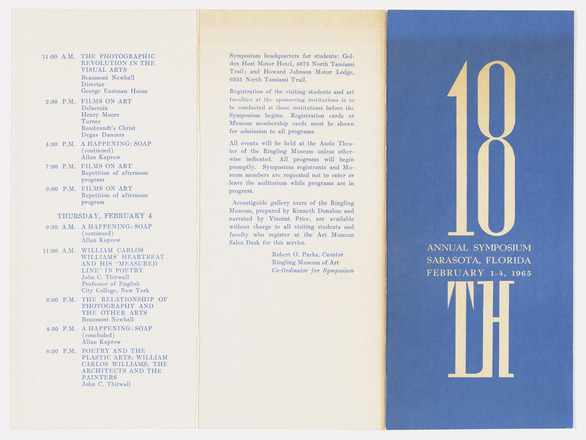
Program for Florida State University’s
Eighteenth Annual Symposium, which included
Kaprow’s Soap (1–4 February 1965)
Notes to Soap (February 1965)
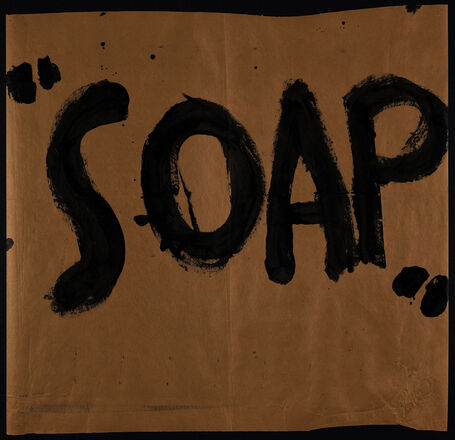
Score for Soap in the form of a poster
(1964–65)
590
| Title | Clipping of a tidal chart of waves at Sarasota Bay, from Soap |
| Date | 1 February 1965 |
| Type | sketches and materials |
| Location | Getty Research Institute, Allan Kaprow Papers, 980063, box 9, folder 6 |
Related
Cite
Clipping of a tidal chart of waves at Sarasota Bay,
from Soap, 1 February 1965. Getty Research
Institute, Allan Kaprow Papers, 980063, box 9, folder
6. In
The Scores Project: Experimental Notation in Music,
Art, Poetry, and Dance, 1950–1975, ed. Michael Gallope, Natilee Harren, and John
Hicks. Los Angeles: Getty Research Institute, 2025.
https://