Graph CE looks a bit like experimental-notation wallpaper or an aleatoric midcentury countertop. Again, clefs are ambiguous. The graph is filled with ledger lines. Uniquely, in this graph John Cage’s four staves are crooked and intersecting such that any given note has one, two, or three different possible “readings.” Cage’s instructions remain minimal, however (“make intervals and aggregates where suggested by notation”), and David Tudor’s reading is correspondingly straightforward. He reads the graph left to right horizontally, and simply assigns one, two, or three pitch values to each note. For note heads with two or three pitches, Tudor uses these pitches as the endpoints of a large cluster, rendered in his realization as two close-together parallel lines, many of which require an entire forearm to play. Dynamic values are reduced to three traditional markings in blue (p, m, f). Aside from a few blasts from the trumpeter Melvyn Broiles, strings dominate the orchestral texture during this moment of this performance, providing Tudor’s solo with plenty of acoustic space.
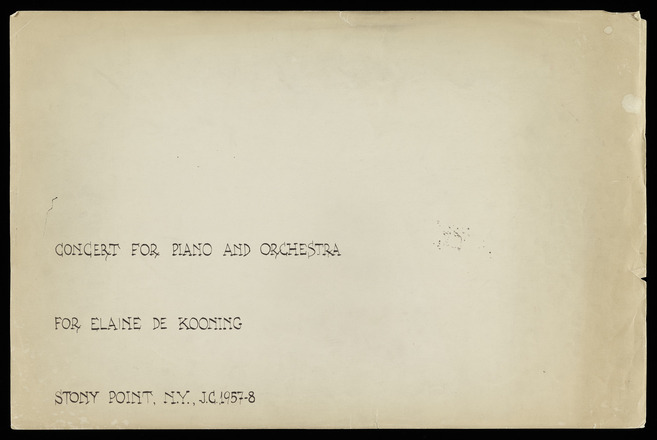
Solo for Piano by John Cage © 1960 by Henmar Press Inc. Permission by C.F. Peters Corporation. All rights reserved. With permission of WERGO, Copyright © 1993. WERGO, a division of Schott Music & Media GmbH. Animated score developed by Michael Gallope and produced by Greg Albers.